. 2011 Jun;344(3):455-69.
doi: 10.1007/s00441-011-1170-1. Epub 2011 May 4.

Sequential morphological characteristics of murine fetal liver hematopoietic microenvironment in Swiss Webster mice

Affiliations

Sequential morphological characteristics of murine fetal liver hematopoietic microenvironment in Swiss Webster mice

Jackline de Paula Ayres-Silva et al. Cell Tissue Res. 2011 Jun.

Abstract

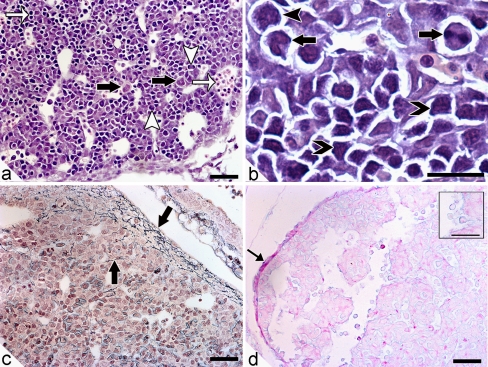
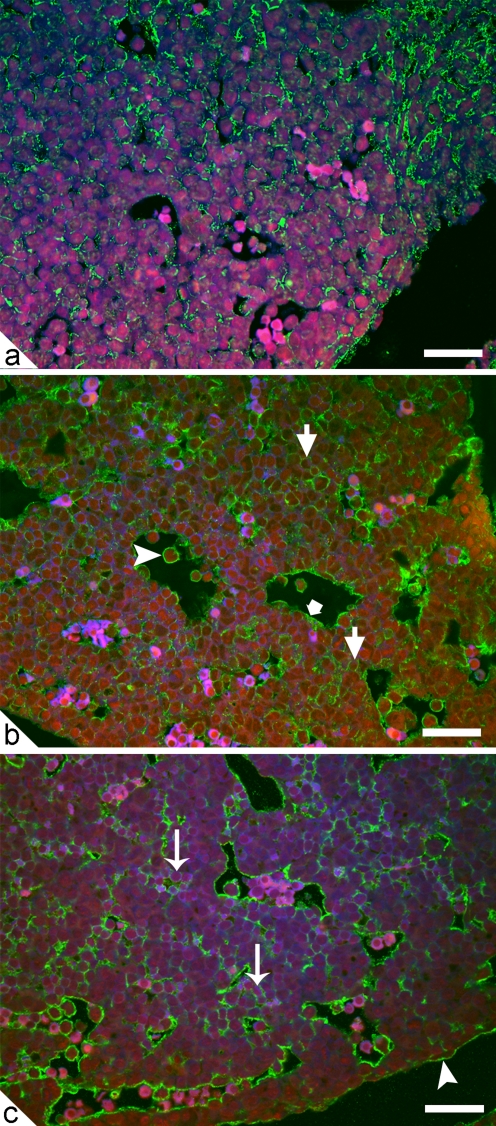
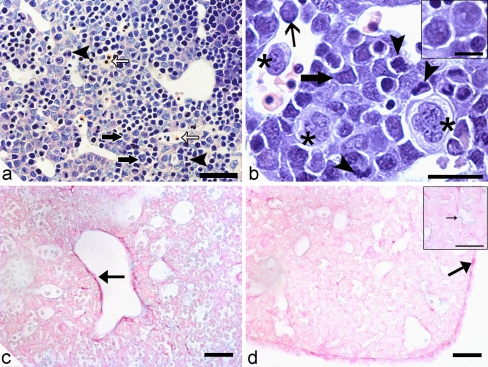
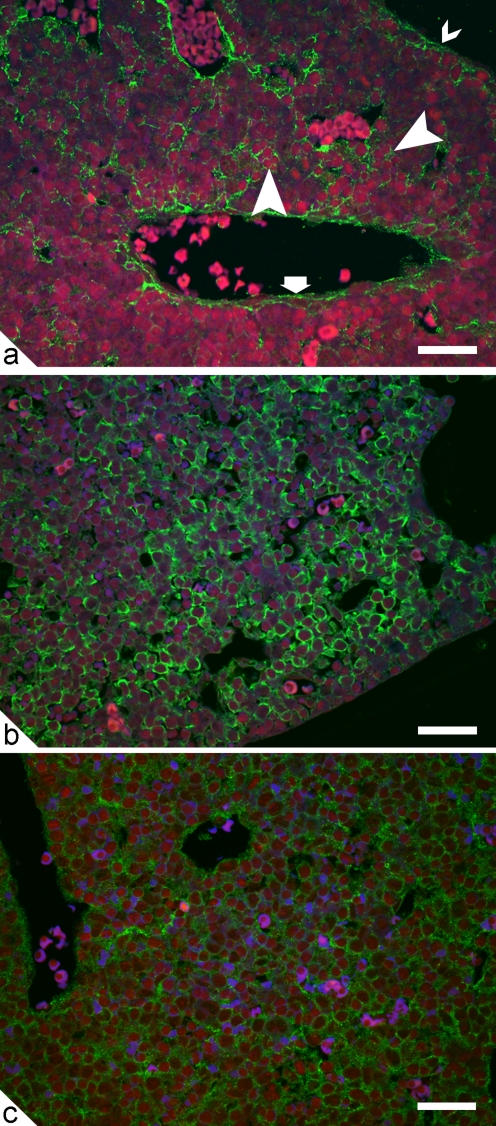
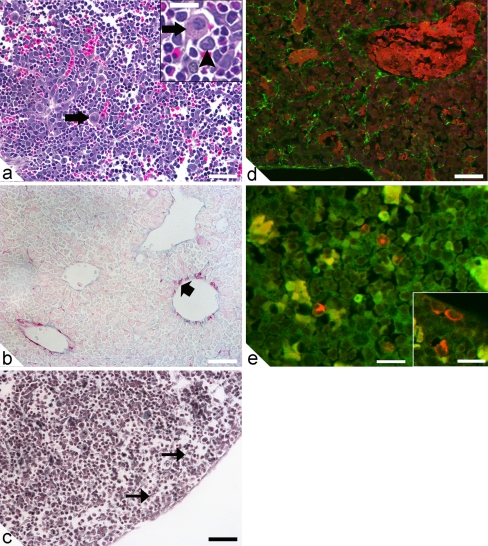
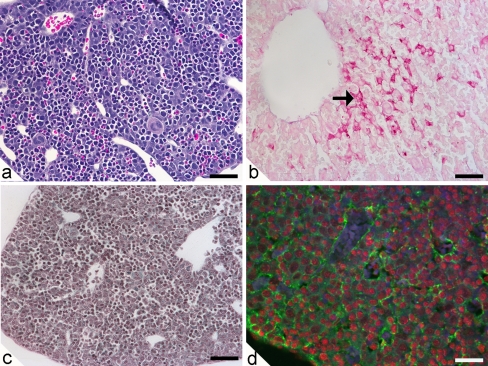
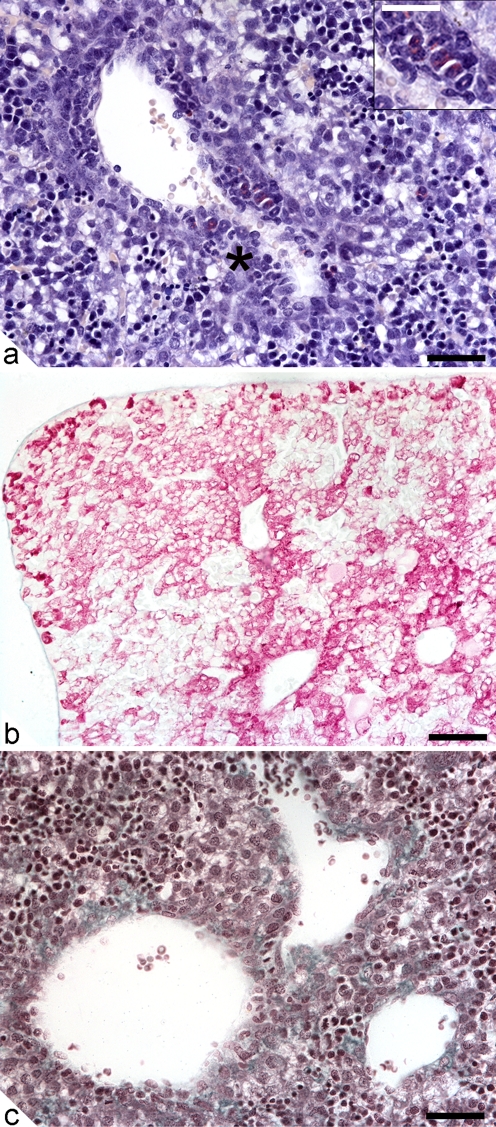
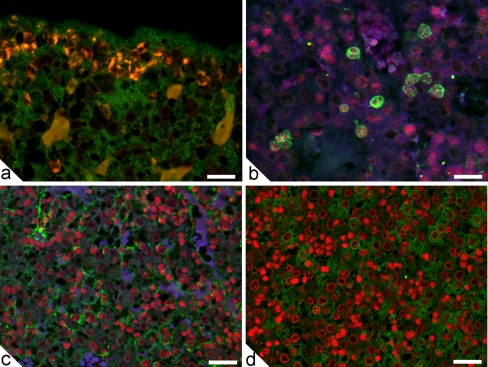
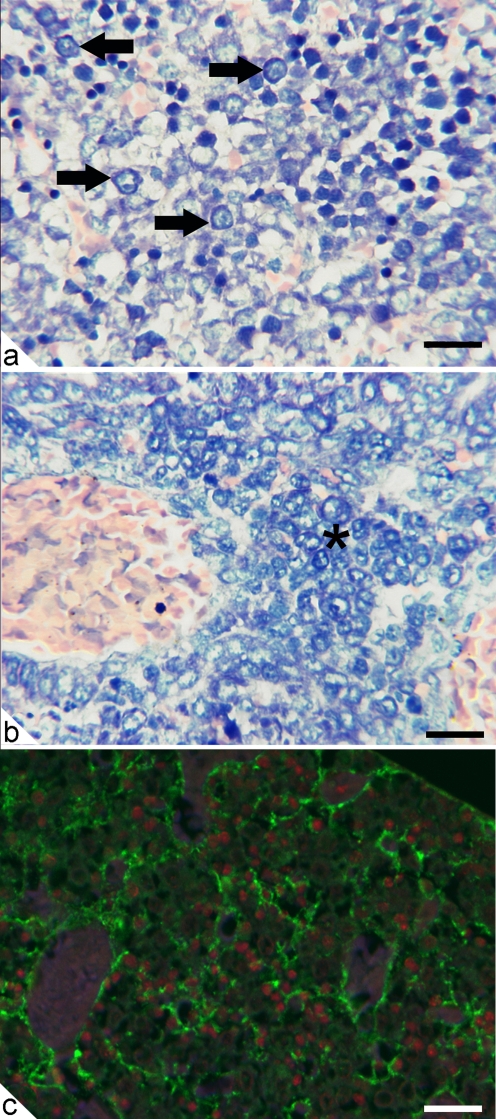
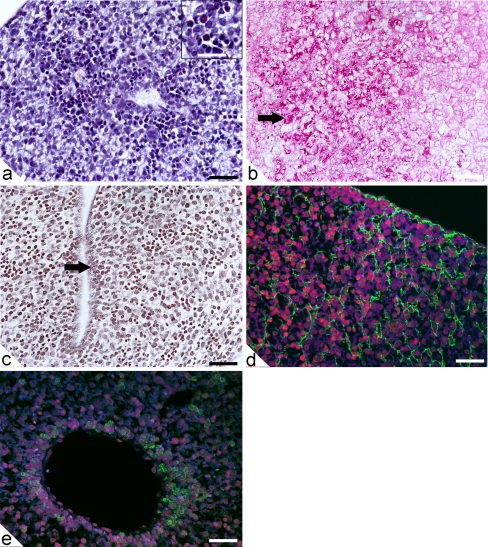
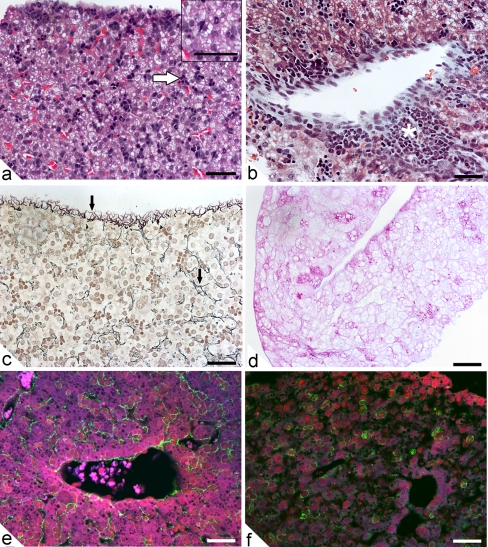
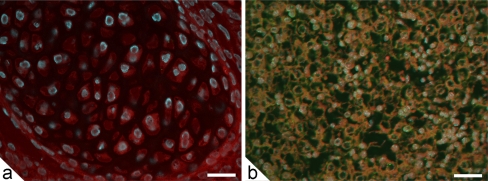
Embryonic hematopoiesis occurs via dynamic development with cells migrating into various organs. Fetal liver is the main hematopoietic organ responsible for hematopoietic cell expansion during embryologic development. We describe the morphological sequential characteristics of murine fetal liver niches that favor the settlement and migration of hematopoietic cells from 12 days post-coitum (dpc) to 0 day post-partum. Liver sections were stained with hematoxylin and eosin, Lennert's Giemsa, Sirius Red pH 10.2, Gomori's Reticulin, and Periodic Acid Schiff/Alcian Blue pH 1.0 and pH 2.5 and were analyzed by bright-field microscopy. Indirect imunohistochemistry for fibronectin, matrix metalloproteinase-1 (MMP-1), and MMP-9 and histochemistry for naphthol AS-D chloroacetate esterase (NCAE) were analyzed by confocal microscopy. The results showed that fibronectin was related to the promotion of hepatocyte and trabecular differentiation; reticular fibers did not appear to participate in fetal hematopoiesis but contributed to the physical support of the liver after 18 dpc. During the immature phase, hepatocytes acted as the fundamental stroma for the erythroid lineage. The appearance of myeloid cells in the liver was related to perivascular and subcapsular collagen, and NCAE preceded MMP-1 expression in neutrophils, an occurrence that appeared to contribute to their liver evasion. Thus, the murine fetal liver during ontogenesis shows two different phases: one immature and mainly endodermic (<14 dpc) and the other more developed (endodermic-mesenchymal; >15 dpc) with the maturation of hepatocytes, a better definition of trabecular pattern, and an increase in the connective tissue in the capsule, portal spaces, and liver parenchyma. The decrease of hepatic hematopoiesis (migration) coincides with hepatic maturation.


Figures

Fig. 1
Fig. 1
Mouse fetal liver at 12 days post-coitum (dpc). a Erythroid lineage cells (thin white arrows): some are still nucleated inside blood vessels. Note the megakaryocytes (black arrows) and some mitotic cells (white arrowheads). Sirius Red pH 10.2 stain. Bar 30 μm. b Erythropoietic foci (black chevrons) together with some immature myeloid cells: promyelocyte (black arrowhead) and myelocytes (black arrows). Sirius Red pH 10.2 stain. Bar 10 μm. c Reticular fibers (black arrows) in the submesothelium layer from the capsule and inside the liver. Gomori’s reticulin stain. Bar 30 μm. d PAS staining polysacharides in the capsule (thin black arrow). Periodic Acid Schiff (PAS)/Alcian Blue (AB) pH 1.0 stain. Bar 30 μm. Insert in d Delicate layer of highly sulfated proteoglycans around cells. PAS-AB pH 1.0 stain. Bar 5.5 μm
Fig. 2
Fig. 2
Mouse fetal liver at 12 dpc (green AlexaFluor488, blue Evans Blue, red DAPI [4,6-diamidino-2-phenylindole]). a Punctiform and discontinuous pattern of fibronectin; the capsule was weakly positive. b Matrix metalloproteinase-1 (MMP-1) expression in endothelial cells of a venule (small fat arrow), in the periphery of some immature and intravascular cells (arrowhead), and in erythroid cells in the parenchyma (arrows). c MMP-9 expression in parenchymal erythroid aggregates (arrows) and in the mesothelial layer (arrowhead). Bars 40 μm
Fig. 3
Fig. 3
Mouse fetal liver at 13 dpc. a Erythroblasts, normoblasts, myeloblasts, and metamyelocytes (black arrows), megakaryoblasts, megakaryocytes, and many cells in mitosis (black arrowheads). Note the nucleated erythroblasts inside vessels (thin white arrows). Lennert’s Giemsa stain. Bar 20 μm. b High-power magnification showing megakaryocytes (stars), erythroid cells (fat arrow), monocyte (thin arrow), and mitotic figures (arrowheads). Sirius Red pH 10.2 stain. Bar 10 μm. Insert in b Monoblast (top right) surrounded by erythroid progenitors. Sirius Red pH 10.2 stain. Bar 5 μm. c PAS reaction around a portal vessel (arrow) and some hepatocytes. Bar 30 μm. d PAS reaction in the capsule (arrow). PAS-AB pH 1.0 stain. Bar 30 μm. Insert in d Delicate layer of highly sulfated proteoglycans around cells (small arrow) and endothelium. PAS-AB pH 1.0 stain. Bar 7.5 μm
Fig. 4
Fig. 4
Mouse fetal liver at 13 dpc (green AlexaFluor488, blue Evans Blue, red DAPI). a Fibronectin in erythroid cells (arrowhead), in endothelial (fat arrow) and subendothelial cells, and in the subcapsular region (chevron). b MMP-1 in the cytoplasm of erythroid cells in the parenchyma and in blood vessels. c MMP-9 dispersed through the parenchyma and presented in venulae walls with a granular pattern. Bars 40 μm
Fig. 5
Fig. 5
Mouse fetal liver at 14 dpc. a Intermediary normoblasts, erythroid cells (some with a nucleus), megakaryoblasts (arrows) and monocytes (arrowhead). Hematoxylin and eosin (HE) stain. Bar 30 μm (insert 10 μm). b PAS-positive reaction in hepatocytes around intrahepatic venulae (arrow) and discontinuous subendothelial cells. Note the mesothelium with a light PAS reaction, and the linear pattern of AB pH 1.0 proteoglycans in the surface of the venular endothelium and around cells. PAS-Alcian Blue pH 1.0 stain. Bar 30 μm. c Note some reticular fibers inside the liver (arrows), but the capsular region is without reticular fibers. Gomori’s reticulin stain. Bar 30 μm. d Fibronectin in sinusoids, in portal veins, and in the subcapsular region (green AlexaFluor488, red Evans Blue, blue DAPI). Bar 40 μm. e Myeloid cells expressing naphthol AS-D chloroacetate esterase (NCAE) in the parenchyma (green Gill’s 3 hematoxylin, red Fast Red). Bar 40 μm. Insert in e Myeloid cells expressing NCAE in the subcapsular region (green Gill’s 3 hematoxylin, red Fast Red). Bar 20 μm
Fig. 6
Fig. 6
Mouse fetal liver at 15 dpc. a Intense erythroid and megakaryocytic proliferation. HE stain. b Hepatocytes with PAS granules (arrow) near sinusoids. PAS-AB pH 1.0 stain. c Hepatic parenchyma and capsulae without reticular fibers. Gomori’s reticulin stain. d Fibronectin in the capsular submesothelial layer, sinusoids, and venula wall (green AlexaFluor488, blue Evans Blue, red DAPI). Bars 30 μm
Fig. 7
Fig. 7
Mouse fetal liver at 16 dpc. a Erythroid lineage cells with many normoblats. Mature neutrophilic and eosinophilic cells (star) in the conjunctive tissue around the large portal veins. Sirius-Red pH 10.2 stain. Bar 30 μm. Insert in a Myeloid focus with many eosinophils (red). Sirius-Red pH 10.2 stain. Bar 7.5 μm. b Mature hepatocytes with a marked amount of PAS-positive granules of glycogen. PAS-AB pH 1.0 stain. Bar 30 μm. c Hepatic parenchyma and large vessels showing no silver impregnation. Gomori’s reticulin stain. Bar 30 μm
Fig. 8
Fig. 8
Mouse fetal liver at 16 dpc. a NCAE in neutrophil foci in the subcapsular region (green Gill’s 3 hematoxylin, red Fast Red). b MMP-1 expression in the cytoplasm of neutrophils (green AlexaFluor488, blue Evans Blue, red DAPI). c Granular fibronectin expression in the venulae and parenchyma (green AlexaFluor488, blue Evans Blue, red DAPI). d Low expression of α-fetoprotein (green AlexaFluor488, red DAPI). Bars 30 μm
Fig. 9
Fig. 9
Mouse fetal liver at 17 dpc. a Lower relative density of erythroid cells compared with previous stages, showing predominance of normoblasts. Note the presence of immunoblastoid cells (arrows). Lennert’s Giemsa stain. b Monocyte cluster (star) with undifferentiated cells around a large portal vein. Lennert’s Giemsa stain. Bars 10 μm. c Fibronectin expression in the venulae walls, in the capsular submesothelial layer, and in perivascular small erythroid cells (green AlexaFluor488, blue Evans Blue, red DAPI). Bar 30 μm
Fig. 10
Fig. 10
Mouse fetal liver at 18 dpc. a Neutrophilic and eosinophilic lineages associated with late erythroblasts in large portal spaces and in the subcapsular region. Sirius Red pH 10.2 stain. Bar 30 μm. Insert Some eosinophils (red). Sirius Red pH 10.2 stain. Bar 7.5 μm. b Mature hepatocytes showing high reactivity to PAS (arrow). PAS-AB pH 1.0 stain. Bar 30 μm. c Reticular fibers appear in the capsule (arrow). Gomori’s reticulin stain. Bar 30 μm. d Fibronectin expression in sinusoids and in the connective submesothelial tissue (green AlexaFluor488, blue Evans Blue, red DAPI). Bar 30 μm. e MMP-1 in the cytoplasm of neutrophils in the large portal spaces (green AlexaFluor488, blue Evans Blue, red DAPI). Bar 30 μm
Fig. 11
Fig. 11
Mouse liver at 0 dpp. a Marked decrease in the erythroid lineage (white arrow), with a few limited proliferative foci. HE stain. Bar 30 μm. Insert in a Presence of myeloid cells in the subcapsular region and of vacuolated hepatocytes. HE stain. Bar 20 μm. b Myeloid proliferative focus (white star) in the connective tissue of the portal space. Masson’s trichrome stain. c Reticular fibers forming a three-dimensional network in the parenchyma and capsular regions (arrows). Gomori’s reticulin stain. Bar 30 μm. d PAS reaction showing glycoproteins in the hepatocytes and delineating hepatocyte vacuolizations. PAS-AB pH 1.0 stain. Bar 30 μm. e Fibronectin showing a granular pattern in the venula wall and sinusoids (green AlexaFluor488, blue Evans Blue, red DAPI). Bar 30 μm. f MMP-1 expression in the cytoplasm of neutrophils (green AlexaFluor488, blue Evans Blue, red DAPI). Bar 30 μm
Fig. 12
Fig. 12
a Negative control with anti-rabbit AlexaFluor488 (cartilage). b Negative MMP-9 expression in the fetal liver at 17 dpc. Bars 30 μm

Similar articles

Cited by

References

    1. Amenta PS, Harrison D. Expression and potential role of the extracellular matrix in hepatic ontogenesis: a review. Microsc Res Tech. 1997;39:372–386. doi: 10.1002/(SICI)1097-0029(19971115)39:4<372::AID-JEMT7>3.0.CO;2-J. - DOI - PubMed
    1. Andrade ZA. Esquistosomiasis hepática: aspectos morfológicos. In: Popper H, Schaffner F, editors. Progresos en patología hepática, vol II. Barcelona: Editorial Científico Médica; 1967. pp. 249–264.
    1. Arias MA, Stewart A. Molecular principles of animal development. Oxford: Oxford University Press; 2002.
    1. Bergers G, Brekken R, Mcmahon G, Vu TH, Itoh T, Tamaki K, Tanzawa K, Thorpe P, Itohara S, Werb Z, Hanahan D. Matrix metalloproteinase-9 triggers the angiogenic switch during carcinogenesis. Nat Cell Biol. 2000;2:737–744. doi: 10.1038/35036374. - DOI - PMC - PubMed
    1. Bogomoletz W. Advantages of the Sirius red staining method for amyloid and eosinophils. Arch Anat Cytol Pathol. 1980;28:252–253. - PubMed

Publication types