Estrogen and insulin-like growth factor-I (IGF-I) independently down-regulate critical repressors of breast cancer growth
- PMID: 21541704
- PMCID: PMC3936881
- DOI: 10.1007/s10549-011-1540-0
Estrogen and insulin-like growth factor-I (IGF-I) independently down-regulate critical repressors of breast cancer growth
Abstract
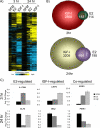
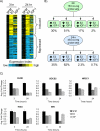
Although estrogen receptor alpha (ERα) and insulin-like growth factor (IGF) signaling are important for normal mammary development and breast cancer, cross-talk between these pathways, particularly at the level of transcription, remains poorly understood. We performed microarray analysis on MCF-7 breast cancer cells treated with estradiol (E2) or IGF-I for 3 or 24 h. IGF-I regulated mRNA of five to tenfold more genes than E2, and many genes were co-regulated by both ligands. Importantly, expression of these co-regulated genes correlated with poor prognosis of human breast cancer. Closer examination revealed enrichment of repressed transcripts. Interestingly, a number of potential tumor suppressors, for example, B-cell linker (BLNK), were down-regulated by IGF-I and E2. Analysis of three down-regulated genes showed that E2-mediated repression occurred independently of IGF-IR, and IGF-I-mediated repression occurred independently of ERα. However, repression by IGF-I or E2 required common kinases, such as PI3K and MEK, suggesting downstream convergence of the two pathways. In conclusion, E2 and IGF-I co-regulate a set of genes that affect breast cancer outcome. There is enrichment of repressed transcripts, and, for some genes, the down-regulation is independent at the receptor level. This may be important clinically, as tumors with active ERα and IGF-IR signaling may require co-targeting of both pathways.
Figures


Similar articles
-
Insulin-like growth factor binding protein-4 and -5 modulate ligand-dependent estrogen receptor-α activation in breast cancer cells in an IGF-independent manner.Cell Signal. 2013 Jun;25(6):1395-402. doi: 10.1016/j.cellsig.2013.02.018. Epub 2013 Mar 14. Cell Signal. 2013. PMID: 23499909
-
Estrogen signaling via a linear pathway involving insulin-like growth factor I receptor, matrix metalloproteinases, and epidermal growth factor receptor to activate mitogen-activated protein kinase in MCF-7 breast cancer cells.Endocrinology. 2007 Aug;148(8):4091-101. doi: 10.1210/en.2007-0240. Epub 2007 May 24. Endocrinology. 2007. PMID: 17525128 Free PMC article.
-
Resveratrol regulates the cell viability promoted by 17β-estradiol or bisphenol A via down-regulation of the cross-talk between estrogen receptor α and insulin growth factor-1 receptor in BG-1 ovarian cancer cells.Food Chem Toxicol. 2013 Sep;59:373-9. doi: 10.1016/j.fct.2013.06.029. Epub 2013 Jun 27. Food Chem Toxicol. 2013. PMID: 23810794
-
Role of estrogen receptor alpha in modulating IGF-I receptor signaling and function in breast cancer.J Exp Clin Cancer Res. 2004 Sep;23(3):385-94. J Exp Clin Cancer Res. 2004. PMID: 15595626 Review.
-
Insulin-like growth factor - oestradiol crosstalk and mammary gland tumourigenesis.Biochim Biophys Acta. 2013 Dec;1836(2):345-53. doi: 10.1016/j.bbcan.2013.10.005. Epub 2013 Nov 2. Biochim Biophys Acta. 2013. PMID: 24189571 Review.
Cited by
-
Newly synthesized chitosan nanoparticles loaded with caffeine/moringa leaf extracts Halt Her2, BRCA1, and BRCA2 expressions.Sci Rep. 2024 Aug 5;14(1):18118. doi: 10.1038/s41598-024-67599-1. Sci Rep. 2024. PMID: 39103402 Free PMC article.
-
Novel Aspects Concerning the Functional Cross-Talk between the Insulin/IGF-I System and Estrogen Signaling in Cancer Cells.Front Endocrinol (Lausanne). 2015 Mar 6;6:30. doi: 10.3389/fendo.2015.00030. eCollection 2015. Front Endocrinol (Lausanne). 2015. PMID: 25798130 Free PMC article. Review.
-
Building a successful fertility preservation program at a major cancer center.J Gynecol Oncol. 2014 Apr;25(2):148-54. doi: 10.3802/jgo.2014.25.2.148. Epub 2014 Apr 9. J Gynecol Oncol. 2014. PMID: 24761219 Free PMC article. Review.
-
Isoflavones in soy flour diet have different effects on whole-genome expression patterns than purified isoflavone mix in human MCF-7 breast tumors in ovariectomized athymic nude mice.Mol Nutr Food Res. 2015 Aug;59(8):1419-30. doi: 10.1002/mnfr.201500028. Epub 2015 Jun 26. Mol Nutr Food Res. 2015. PMID: 25820259 Free PMC article.
-
Bioavailable insulin-like growth factor-I as mediator of racial disparity in obesity-relevant breast and colorectal cancer risk among postmenopausal women.Menopause. 2017 Mar;24(3):288-298. doi: 10.1097/GME.0000000000000753. Menopause. 2017. PMID: 27749737 Free PMC article.
References
-
- Bocchinfuso WP, Korach KS. Mammary gland development and tumorigenesis in estrogen receptor knockout mice. J Mammary Gland Biol Neoplasia. 1997;2:323–34. - PubMed
-
- Carroll JS, Meyer CA, Song J, Li W, Geistlinger TR, Eeckhoute J, Brodsky AS, Keeton EK, Fertuck KC, Hall GF, Wang Q, Bekiranov S, Sementchenko V, Fox EA, Silver PA, Gingeras TR, Liu XS, Brown M. Genome-wide analysis of estrogen receptor binding sites. Nat Genet. 2006;38:1289–97. - PubMed
-
- Casa AJ, Dearth RK, Litzenburger BC, Lee AV, Cui X. The type I insulin-like growth factor receptor pathway: a key player in cancer therapeutic resistance. Front Biosci. 2008;13:3273–87. - PubMed
-
- Cascio S, Bartella V, Garofalo C, Russo A, Giordano A, Surmacz E. Insulin-like growth factor 1 differentially regulates estrogen receptor-dependent transcription at estrogen response element and AP-1 sites in breast cancer cells. J Biol Chem. 2007;282:3498–506. - PubMed
-
- Cicatiello L, Scafoglio C, Altucci L, Cancemi M, Natoli G, Facchiano A, Iazzetti G, Calogero R, Biglia N, De Bortoli M, Sfiligoi C, Sismondi P, Bresciani F, Weisz A. A genomic view of estrogen actions in human breast cancer cells by expression profiling of the hormone-responsive transcriptome. J Mol Endocrinol. 2004;32:719–75. - PubMed
Publication types
MeSH terms
Substances
Grants and funding
LinkOut - more resources
Full Text Sources
Other Literature Sources
Medical
Molecular Biology Databases
Miscellaneous

