Review
. 2011 Jul;401(1):17-27.
doi: 10.1007/s00216-011-5003-6. Epub 2011 May 4.

MALDI tissue imaging: from biomarker discovery to clinical applications

Affiliations
Review

MALDI tissue imaging: from biomarker discovery to clinical applications

Lisa H Cazares et al. Anal Bioanal Chem. 2011 Jul.

Abstract

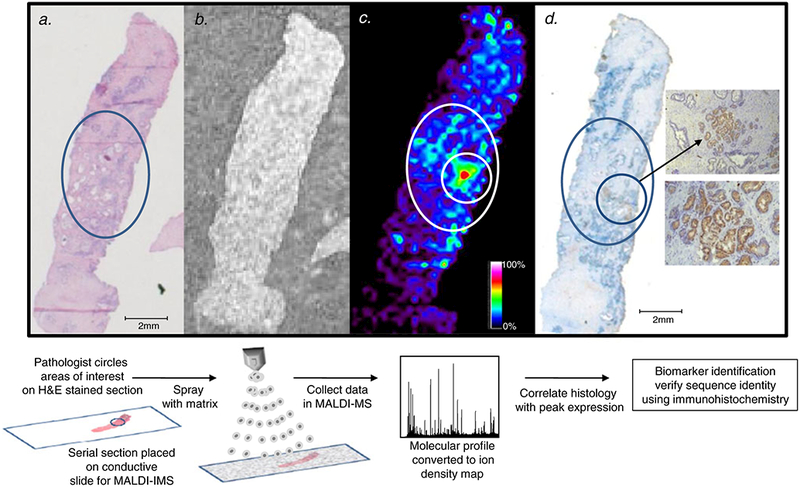
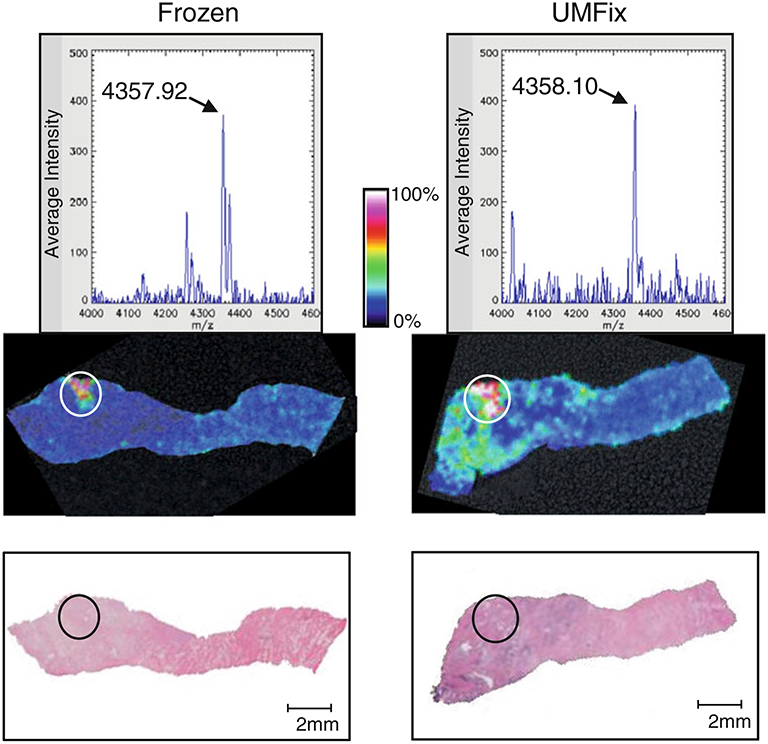
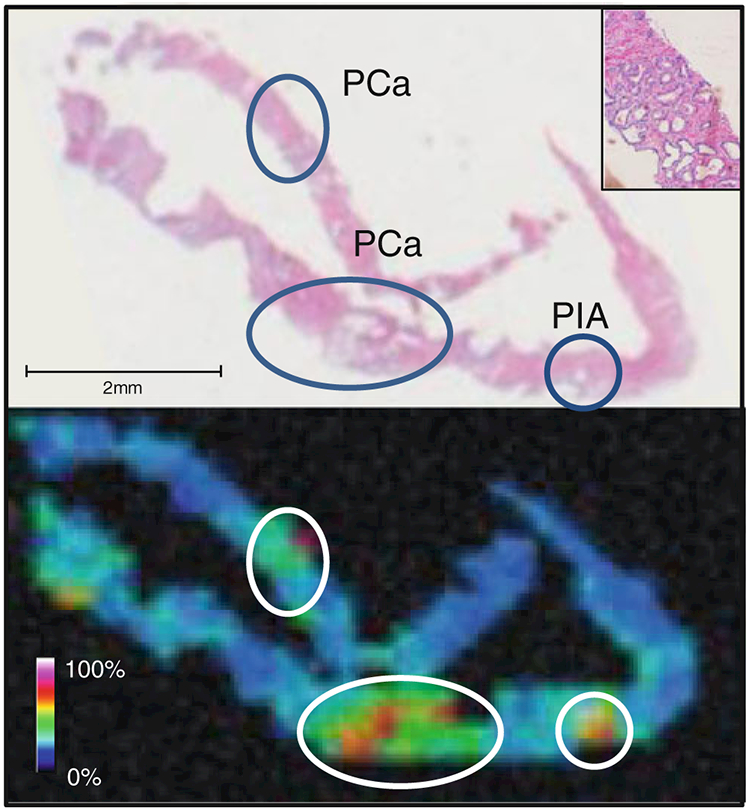
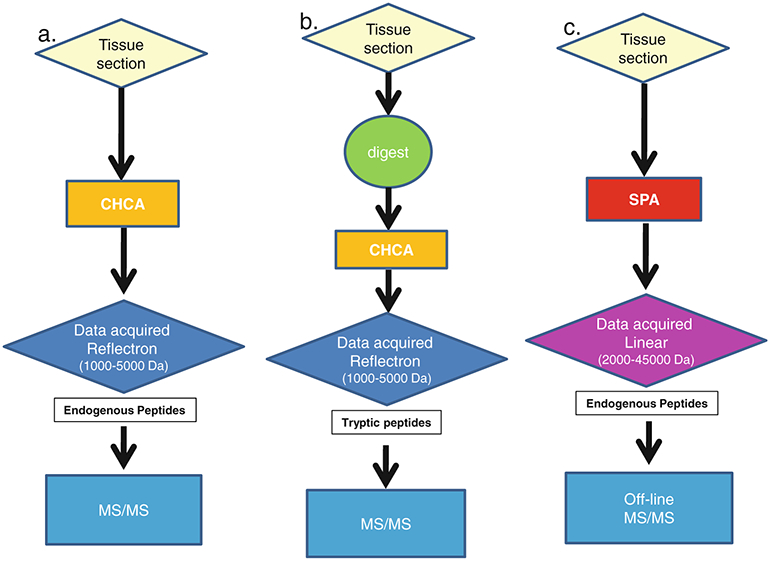
Matrix-assisted laser desorption ionization (MALDI) imaging mass spectrometry (IMS) is a powerful tool for the generation of multidimensional spatial expression maps of biomolecules directly from a tissue section. From a clinical proteomics perspective, this method correlates molecular detail to histopathological changes found in patient-derived tissues, enhancing the ability to identify candidates for disease biomarkers. The unbiased analysis and spatial mapping of a variety of molecules directly from clinical tissue sections can be achieved through this method. Conversely, targeted IMS, by the incorporation of laser-reactive molecular tags onto antibodies, aptamers, and other affinity molecules, enables analysis of specific molecules or a class of molecules. In addition to exploring tissue during biomarker discovery, the integration of MALDI-IMS methods into existing clinical pathology laboratory practices could prove beneficial to diagnostics. Querying tissue for the expression of specific biomarkers in a biopsy is a critical component in clinical decision-making and such markers are a major goal of translational research. An important challenge in cancer diagnostics will be to assay multiple parameters in a single slide when tissue quantities are limited. The development of multiplexed assays that maximize the yield of information from a small biopsy will help meet a critical challenge to current biomarker research. This review focuses on the use of MALDI-IMS in biomarker discovery and its potential as a clinical diagnostic tool with specific reference to our application of this technology to prostate cancer.


Figures

Fig. 1
Fig. 1
Workflow of matrix-assisted laser desorption ionization (MALDI) imaging mass spectrometry (IMS) for biomarker discovery. a a pathologist reviews the hematoxylin and eosin (H&E)-stained tissue and circles a region of prostate cancer. b a serial section is placed on a conductive slide and sprayed with matrix. c the spatial expression of the m/z 4,355 MEKK2 peptide in the prostate tissue collected using MALDI-IMS with a raster width of 200 μm correlates to the circled prostate cancer region. The relative expression of m/z 4,355 is color-coded according to the inset scale. d immunohisto-chemistry (IHC) staining of MEKK2 expression, showing strong staining in the circled areas that correspond to regions of high m/z 4,355 expression. Magnified views of the stained prostate cancer cells are shown in the insets: top ×10 and bottom ×40
Fig. 2
Fig. 2
Comparison of MALDI-IMS data in frozen and universal molecular fixative (UMFix)-processed tissue in a pair of matched prostate tissue samples. A tissue sample was harvested from a prostate surgery specimen and bisected. One half was snap-frozen (left) and the other was treated with UMFix (right). Top panels: Representative spectra of the m/z 4,355 ion. Middle panels: MALDI-IMS map showing high expression of m/z 4,355 in specific areas where tumor cells are located (circled) in the H&E staining image (bottom panel)
Fig. 3
Fig. 3
MALDI-IMS of prostate biopsy cores. Top panel·. Two 18-guage-needle biopsy cores preserved in UMFix with tumor regions of interest determined by a pathologist circled in the H&E-stained serial section. The inset shows the area of prostate cancer at ×10 magnification. Bottom panel: An example of a MALDI-IMS map showing detection of the m/z 4,355 MEKK2 in a serial section of the biopsy cores. PCa prostrate cancer, P1A Prostatic Inflammatory Atrophy
Fig. 4
Fig. 4
Schemes for data collection and sequence identification after MALDI-IMS methods for endogenous peptides and proteins. a. Scheme for the identification of abundant endogenous peptides (1–5 kDa) directly from a tissue section. b. Scheme for the identification tryptic peptides using “in situ” protease digestion followed by data acquisition in reflectron mode and MS/MS analysis. c. Scheme for the identification of endogenous proteins and large peptides using linear mode acquisition followed by off-line MS/MS. CHCA α-cyano-4-hydroxycinnamic acid, SPA sinapinic acid
Fig. 5
Fig. 5
In situ trypsin digestion of prostate tissue. A tissue core was harvested from a prostate surgery specimen and serial sections were made. a. One section was sprayed with trypsin, and one was used as a control. Tissues were sprayed with CHCA and spectra were collected in reflectron mode. b. one peptide at m/z 1,408.75 was selected for in situ MS/MS and produced a fragmentation spectrum which was identified as corresponding to a peptide of transgelin with a MASCOT ion score of 86
Fig. 6
Fig. 6
Conjugation of a triarylmethyl (trityl) mass tag to an antibody molecule. Covalent attachment of the trityl mass tag to the primary amine of an antibody is facilitated by the N-hydroxysuccinimide ester group on the trityl molecule. In the MALDI mass spectrometer the trityl group absorbs the energy from the laser, resulting in cleavage of the C–S bond, creation of a stable carbocation, and release of the trityl mass tag
Fig. 7
Fig. 7
Targeted MALDI-IMS for prostate-specific antigen (PSA). a. Resulting image from targeted IMS (TIMS) of prostate tissue showing the spatial distribution of the trityl tag (m/z 519.5) (left panel) which was bound to PSA in areas which also stained for PSA in traditional IHC for PSA (right panel) in a serial section. b. Resulting reflectron mode spectrum after release of the mass tag from the antibody by the MALDI laser
Fig. 8
Fig. 8
Targeted carbohydrate affinity labeling of sialyl Lewis X antigen expression in renal tissue. a. An H&E image of a clear cell renal carcinoma (RCC) tissue slice. The area of tumor is circled in blue. b. A serial slice of the same tissue incubated with a sialyl Lewis antigen targeting affinity molecule linked to a trityl reporter tag. Shown is the image of the spatial distribution of the trityl tag (m/z 519.5), highlighting the most intense signal in the circled tumor area

References

    1. Hillenkamp F et al. (1991) Anal Chem 63(24):1193A–1203A - PubMed
    1. Vestal ML (2009) J Mass Spectrom 44(3):303–317 - PubMed
    1. Cazares LH et al. (2009) Clin Cancer Res 15(17):5541–5551 - PubMed
    1. Agar NY et al. (2010) Methods Mol Biol 656:415–431 - PubMed
    1. Caldwell RL, Caprioli RM (2005) Mol Cell Proteomics 4(4):394–401 - PubMed

MeSH terms

Substances