. 2011 Jul 30;32(10):2273-89.
doi: 10.1002/jcc.21814. Epub 2011 May 3.

Implementation and evaluation of a docking-rescoring method using molecular footprint comparisons

Affiliations

Implementation and evaluation of a docking-rescoring method using molecular footprint comparisons

Trent E Balius et al. J Comput Chem. .

Abstract

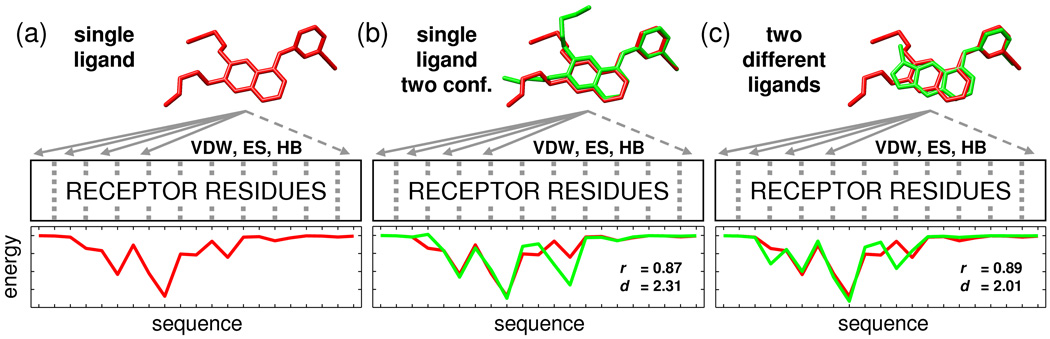
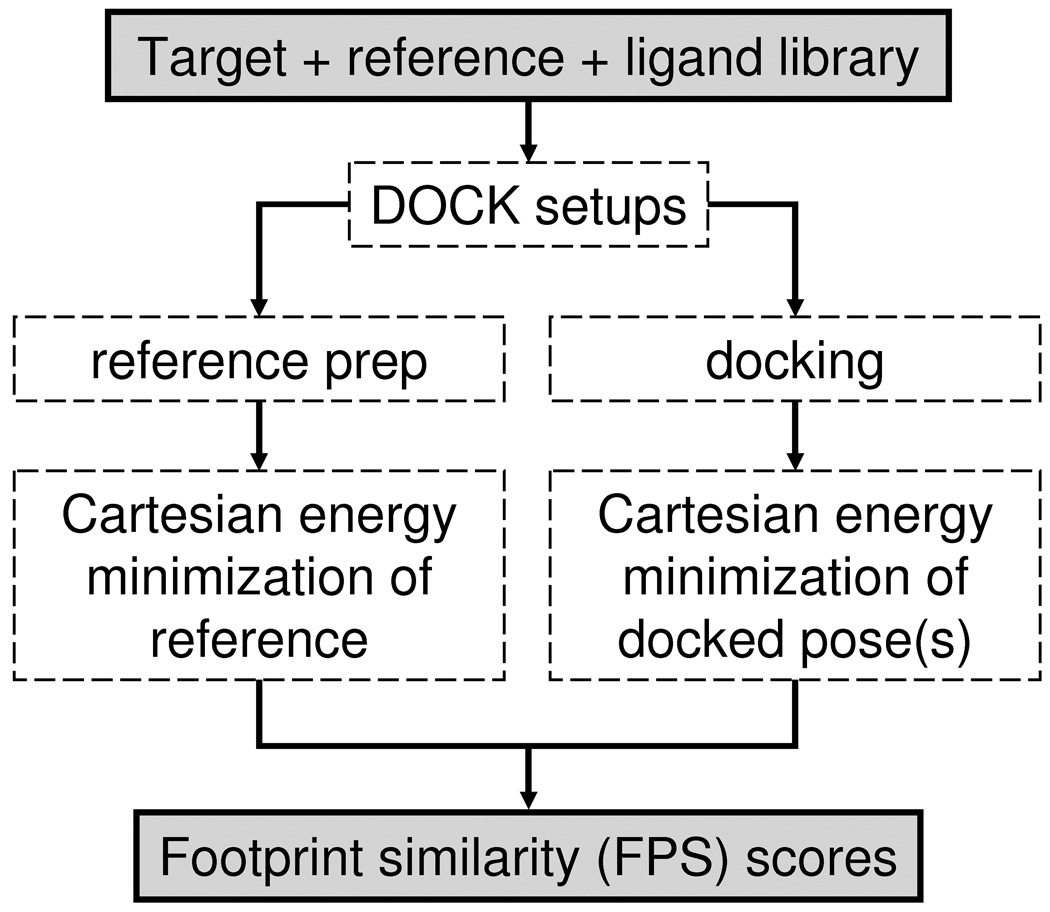
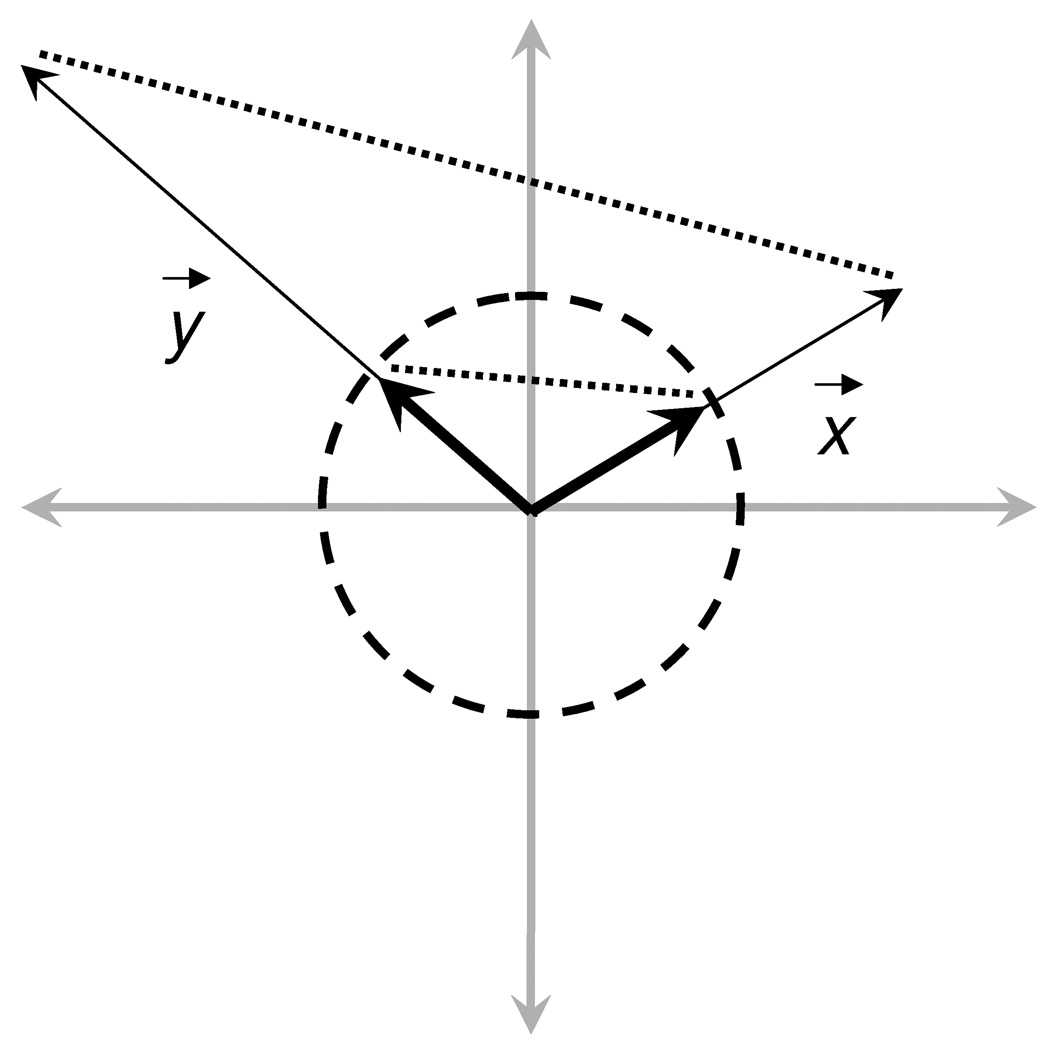
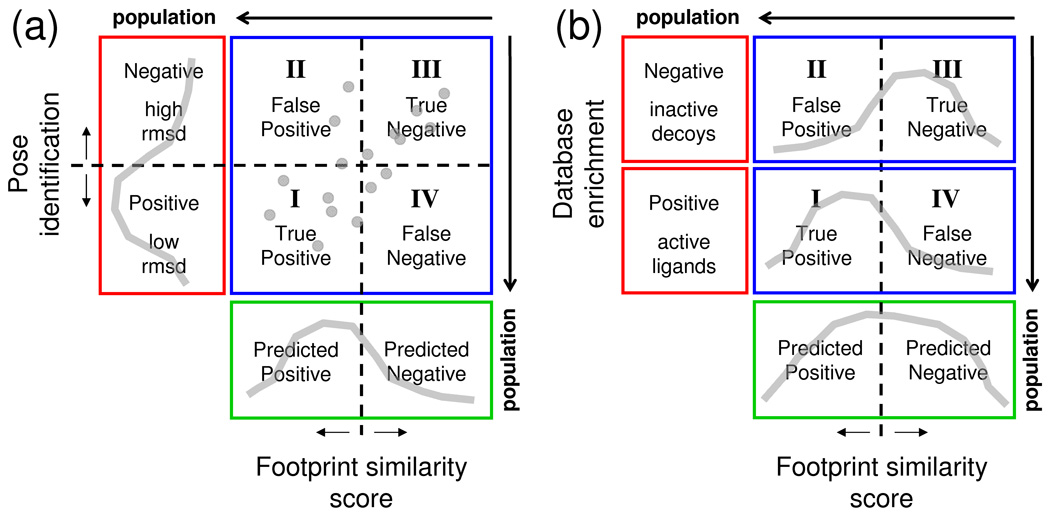
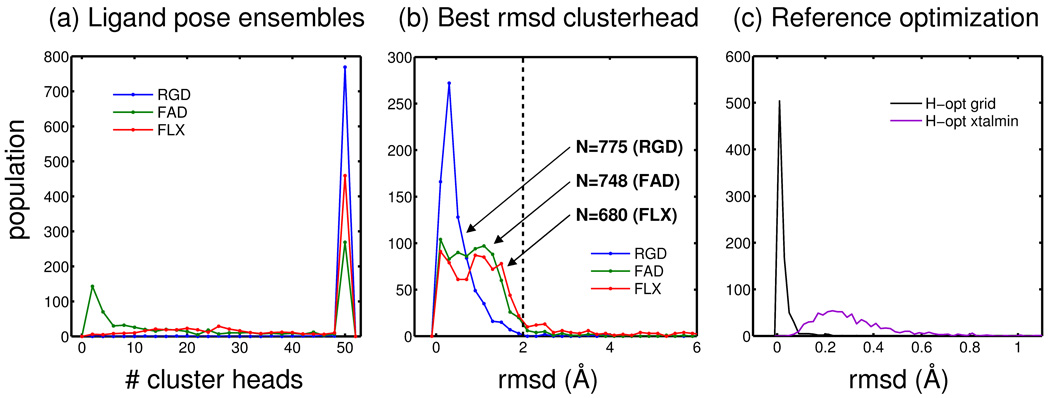
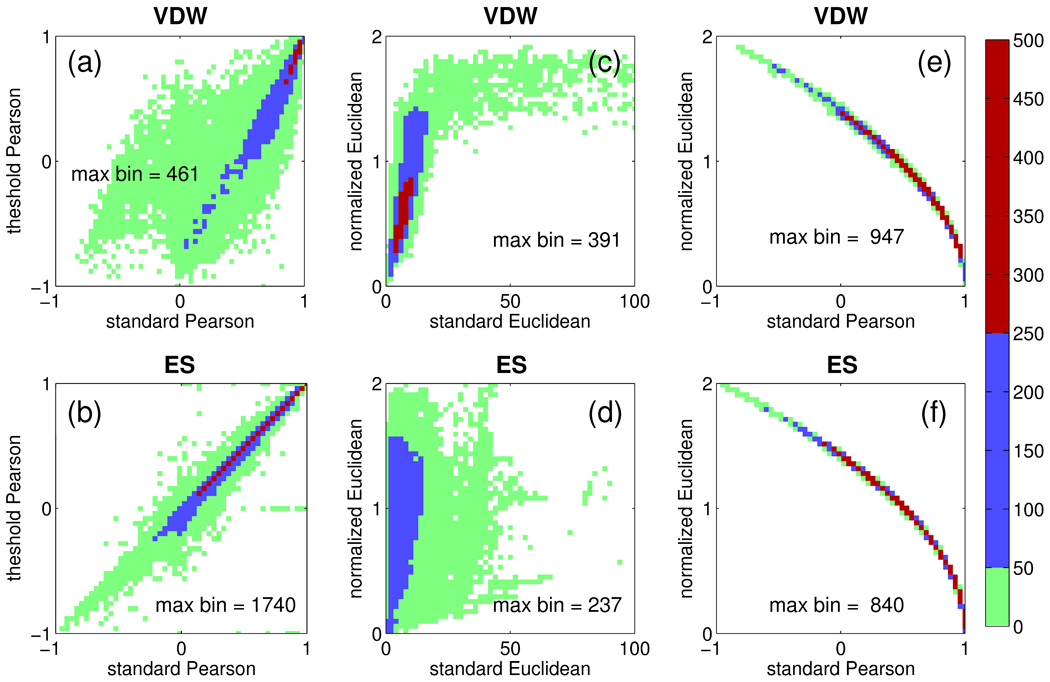
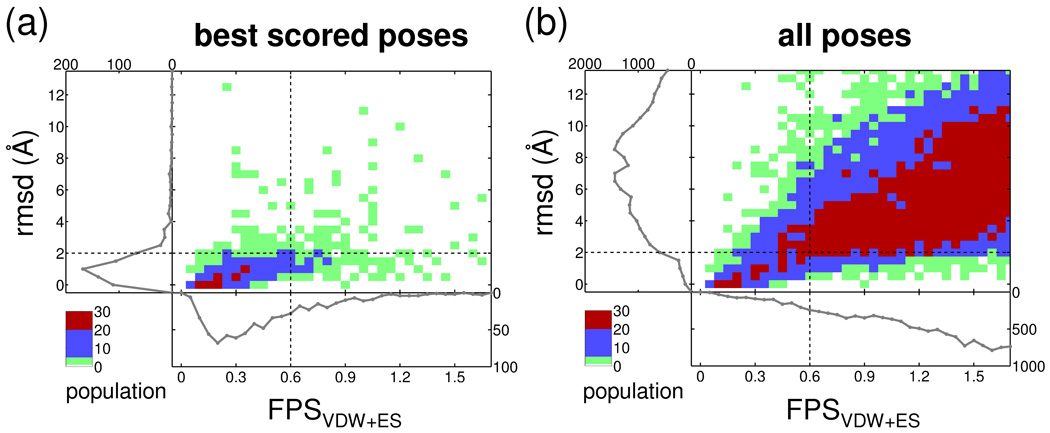
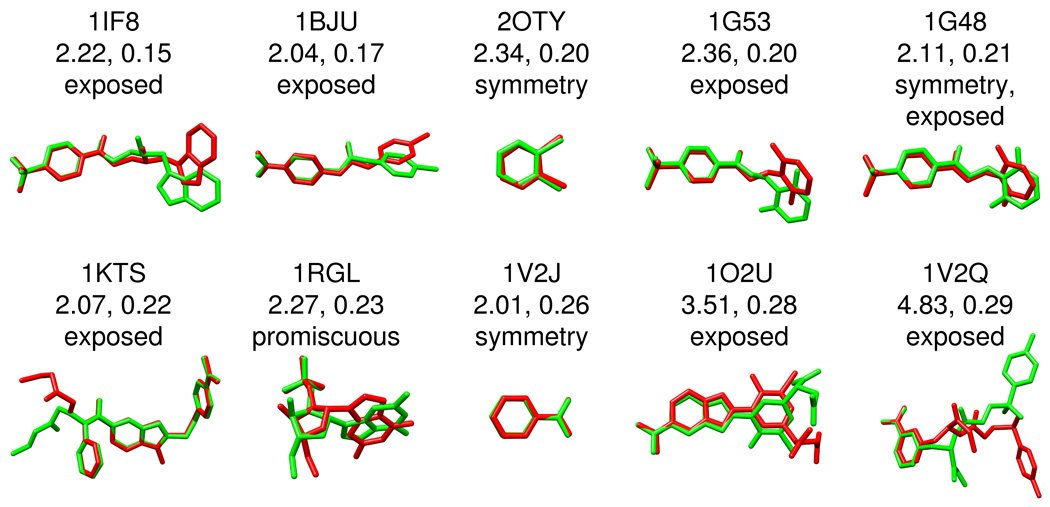
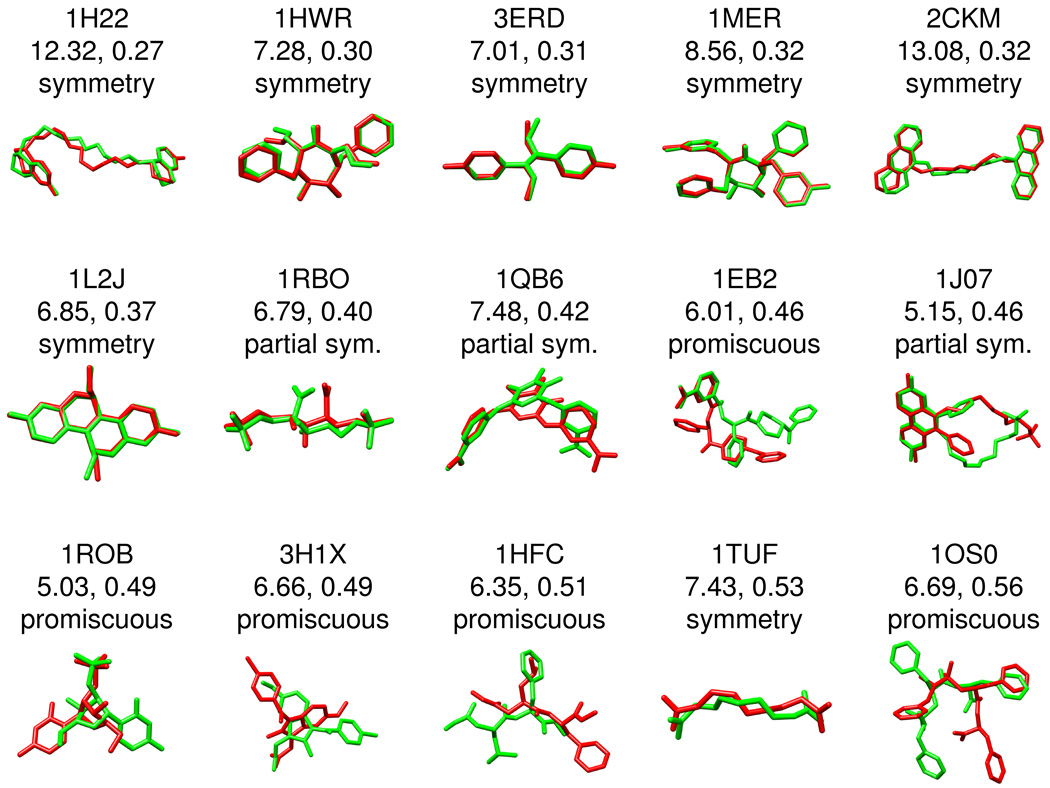
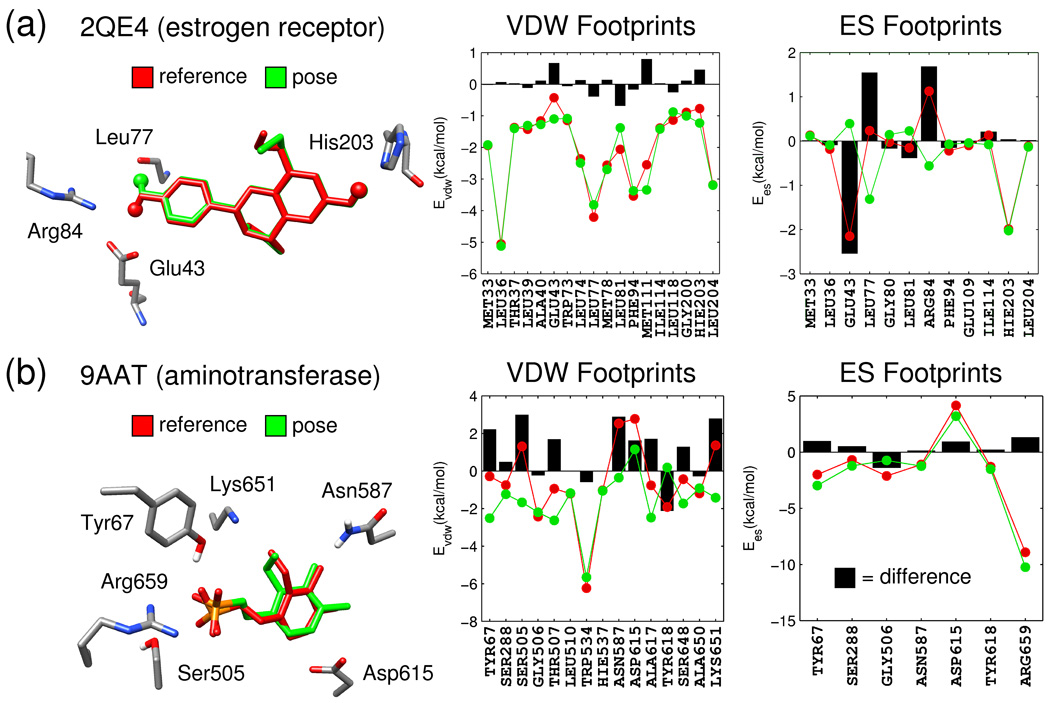
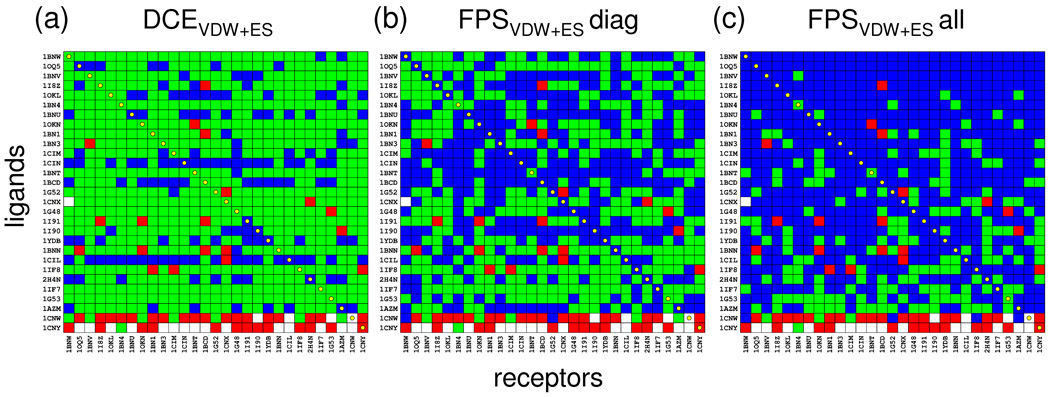
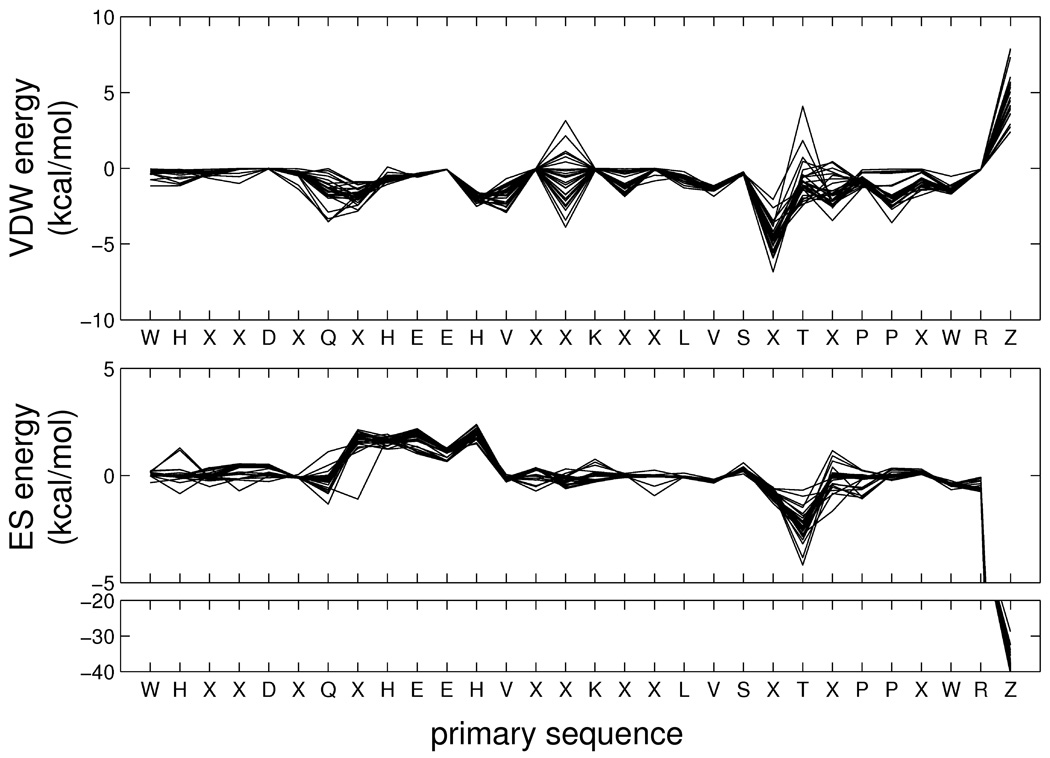
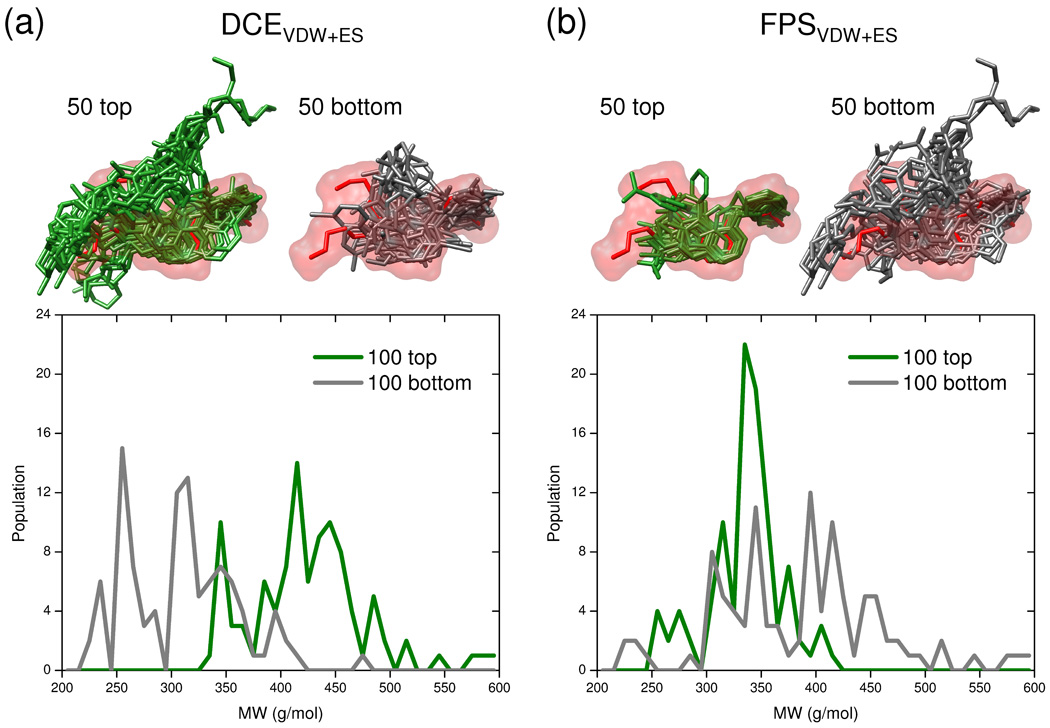
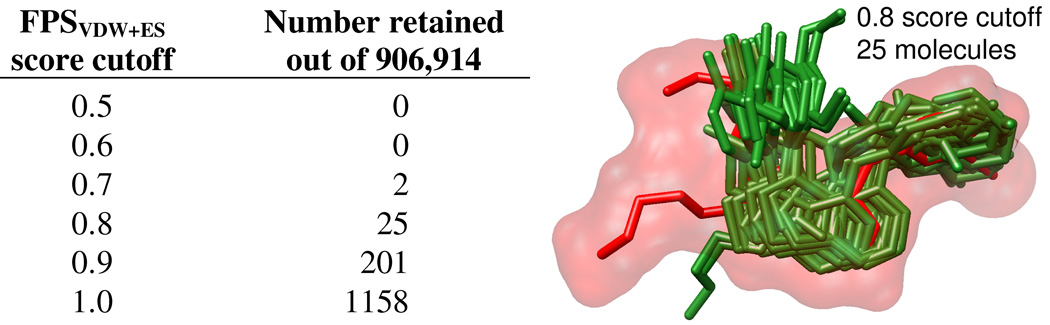
A docking-rescoring method, based on per-residue van der Waals (VDW), electrostatic (ES), or hydrogen bond (HB) energies has been developed to aid discovery of ligands that have interaction signatures with a target (footprints) similar to that of a reference. Biologically useful references could include known drugs, inhibitors, substrates, transition states, or side-chains that mediate protein-protein interactions. Termed footprint similarity (FPS) score, the method, as implemented in the program DOCK, was validated and characterized using: (1) pose identification, (2) crossdocking, (3) enrichment, and (4) virtual screening. Improvements in pose identification (6–12%) were obtained using footprint-based (FPS(VDW+ES)) vs. standard DOCK (DCE(VDW+ES)) scoring as evaluated on three large datasets (680–775 systems) from the SB2010 database. Enhanced pose identification was also observed using FPS (45.4% or 70.9%) compared with DCE (17.8%) methods to rank challenging crossdocking ensembles from carbonic anhydrase. Enrichment tests, for three representative systems, revealed FPSVDW+ES scoring yields significant early fold enrichment in the top 10% of ranked databases. For EGFR, top FPS poses are nicely accommodated in the molecular envelope defined by the reference in comparison with DCE, which yields distinct molecular weight bias toward larger molecules. Results from a representative virtual screen of ca. 1 million compounds additionally illustrate how ligands with footprints similar to a known inhibitor can readily be identified from within large commercially available databases. By providing an alternative way to rank ligand poses in a simple yet directed manner we anticipate that FPS scoring will be a useful tool for docking and structure-based design.

Keywords: Euclidean distance; Pearson correlation; ROC curves; docking; enrichment; molecular fingerprints; molecular footprints; pose comparison; pose rescoring; virtual screening.


Figures

Figure 1
Figure 1
Representative molecular footprints for (a) a single ligand, (b) a single ligand with two conformations, and (c) two different ligands derived from per-residue decomposition of the intermolecular van der Waals interactions as a function of primary sequence. For two footprints, similarity may be quantified using Pearson correlation coefficient (r), Euclidean distance (d), or related measures. For clarity, only a portion of the footprints are shown.
Figure 2
Figure 2
Flow chart outlining FPS calculation protocol.
Figure 3
Figure 3
Schematic depiction of standard (thin) versus normalized (thick) footprint vectors (x, y). The maximum distance between normalized vectors on the unit circle is 2 while the distance between standard vectors can be infinite
Figure 4
Figure 4
Partitioning of outcome space (positive or negative results, red region) as a function of prediction (predicted positive or predicted negative, green region) into four quadrants (blue region) representing (I) true positives, (II) false positives, (III) true negatives, and (IV) false negatives for (a) pose identification and (b) database enrichment definitions of success. Gray colored lines represent hypothetical data
Figure 5
Figure 5
Database preparation histograms. (a) Population of systems with a given number of clusterheads (max 5 50) derived from Cartesian space minimizations of grid-based results reported by Mukherjee et al. (b) Population of systems with a given rmsd using only the single lowest-rmsd pose found among the ensemble of poses retained. The portion to the left of the dashed line at 2 A ° rmsd constitutes perfect sampling subsets for (RGD 5 775), fixed-anchor (FAD 5 748), and flexible (FLX 5 680) ligand sampling. (c) Population of ligand rmsds for reference poses after polar hydrogen optimizations using the energy grids (black line) and subsequent energy minimizations in Cartesian space (purple line) using a harmonic tether
Figure 6
Figure 6
Functional relationships between FPS scores computed for van der Waals (VDW, top) and electrostatic (ES, bottom) interactions using (a, b) standard Pearson vs. threshold Pearson, (c, d) standard Euclidean vs. normalized Euclidean, and (e, f) standard Pearson vs. normalized Euclidean. Population color ranges for green 5 [1, 50], blue 5 [51, 250], and red 5 [251, 5001] are derived from the total FLX ensemble of N 5 26,830 footprints.
Figure 7
Figure 7
Two dimensional histograms of rmsd versus FPSVDW1ES score for (a) the best scored poses (N 5 680) and (b) the entire ensemble derived from all poses (N 5 26,830). Population color ranges for green 5 [1, 5], blue 5 [6, 20], and red 5 [21, 301].
Figure 8
Figure 8
False positive examples type I. Excellent similarity scores (FPSVDW1ES\0.3) but classified as failures due to a close-to-medium geometric match (rmsd [ 2 A° and \ 5 A°). The associated PDB code, rmsd in A °, FPS score, and overlay of the predicted (green) versus crystallographic (red) pose are shown for each system
Figure 9
Figure 9
False positive examples type II. Good similarity scores (FPSVDW1ES\0.6) but classified as failures due to a poor geometric match (rmsd [ 5 A°). The associated PDB code, rmsd in A °, FPS score, and overlay of the predicted (green) versus crystallographic (red) pose are shown for each system.
Figure 10
Figure 10
Pose and footprint comparisons for (a) 2QE4 and (b) 9AAT showing results for the reference pose in red, the docked pose in green, and per-residue differences as black bars.
Figure 11
Figure 11
Pose identification results for the carbonic anhydrase family using crossdocking ensembles from Mukherjee et al. Blue, green, red, and white elements indicate successes, scoring failures, sampling failures, and incomplete growth, respectively. Three scoring methods were evaluated: (a) standard DCEVDW1ES, (b) FPSVDW1ES in which cognate ligands (diagonals) were used as the footprint-reference corresponding to each receptor, (c) FPSVDW1ES in which footprintreferences were derived by minimizing each ligand in each receptor and every matrix element used a unique reference. Note that in all cases the rmsd references employed the set of ligands minimized in each receptor.
Figure 12
Figure 12
Cognate protein-ligand footprints for the aligned carbonic anhydrase family. Residue X indicates a given residue is not conserved across all crystal structures from the PDB entries in terms of amino acid sequence or signifies a substitution or deletion
Figure 13
Figure 13
ROC enrichment curves for (a) neuraminidase, (b) trypsin, and (c) EGFR using different ranking methods
Figure 14
Figure 14
Graphical representation of the 50 top and 50 bottom ranked poses obtained from docking the 475 active ligands from the DUD EGFR database and using (a) DCEVDW1ES and (b) FPSVDW1ES scoring functions. The reference (erlotinib) is shown in red surface with top ligands in green and bottom ligands in gray. On the bottom are corresponding histograms of molecular weight (MW) for the 100 top (best) and 100 bottom (worst) ranked molecules. Note that the large MW peak at ca. 340 for the 100 best scoring molecules using FPSVDW1ES corresponds ca. to the MW of the erlotinib reference (393.44 g/mol).
Figure 15
Figure 15
Number of molecules retained from a virtual screen of 906,914 molecules to EGFR using various FPSVDW1ES score cutoff values. The graphic shows the 25 molecules identified (green) using a cutoff of 0.8 in comparison with the known drug erlotinib (red) which was used as the footprint reference

Similar articles

Cited by

References

    1. Kuntz ID. Science. 1992;257:1078–1082. - PubMed
    1. Jorgensen WL. Science. 2004;303:1813–1818. - PubMed
    1. Shoichet BK. Nature. 2004;432:862–865. - PMC - PubMed
    1. McGaughey GB, Sheridan RP, Bayly CI, Culberson JC, Kreatsoulas C, Lindsley S, Maiorov V, Truchon JF, Cornell WD. J Chem Inf Model. 2007;47:1504–1519. - PubMed
    1. Irwin JJ. J Comput Aided Mol Des. 2008;22:193–199. - PubMed

Publication types