. 2011 May;26(5):1084-98.
doi: 10.1002/jbmr.299.

APPswe/Aβ regulation of osteoclast activation and RAGE expression in an age-dependent manner

Affiliations

APPswe/Aβ regulation of osteoclast activation and RAGE expression in an age-dependent manner

Shun Cui et al. J Bone Miner Res. 2011 May.

Abstract

Alzheimer's disease (AD), one of the most dreaded neurodegenerative disorders, is characterized by cortical and cerebrovascular amyloid β peptide (Aβ) deposits, neurofibrillary tangles, chronic inflammation, and neuronal loss. Increased bone fracture rates and reduced bone density are commonly observed in patients with AD, suggesting one or more common denominators between both disorders. However, very few studies are available that have addressed this issue. Here, we present evidence for a function of amyloid precursor protein (APP) and Aβ in regulating osteoclast (OC) differentiation in vitro and in vivo. Tg2576 mice, which express the Swedish mutation of APP (APPswe) under the control of a prion promoter, exhibit biphasic effects on OC activation, with an increase of OCs in younger mice (< 4 months old), but a decrease in older Tg2576 mice (> 4 months old). The increase of OCs in young Tg2576 mice appears to be mediated by Aβ oligomers and receptor for advanced glycation end products (RAGE) expression in bone marrow macrophages (BMMs). However, the decrease of OC formation and activity in older Tg2576 mice may be due to the increase of soluble rage (sRAGE) in aged Tg2576 mice, an inhibitor of RANKL-induced osteoclastogenesis. These results suggest an unexpected function of APPswe/Aβ, reveal a mechanism underlying altered bone remodeling in AD patients, and implicate APP/Aβ and RAGE as common denominators for both AD and osteoporosis.


Figures

Figure 1
Figure 1
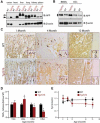
Age‐dependent effects on OC formation and activity in Tg2576 mice. (A,B) Western blot analysis of APP protein expression in different tissues of adult wild type and Tg2576 mice (A) and in BMMs and OC cells derived from wild type and Tg2576 mice (B). ∼50 µg lysates from indicated tissue or cell homogenates were loaded onto SDS‐PAGE and subjected to Western blot analysis using indicated antibodies. (C,D) Tartrate‐resistant acid phosphatase (TRAP) staining analysis of OCs in different‐aged Tg2576 mice. Sections of femurs from WT and Tg2576 mice at indicated age were stained for TRAP activity (purple) to identify OCs. The data were quantified and illustrated in (D). (E) Measurement of serum Pyd levels in different‐aged WT and Tg2576 mice by RIA. In (D) and (E), Mean ± SD from 3 different samples (n = 3) are shown. * and #, p < .05, a significant difference from WT control (Student's t‐test).
Figure 2
Figure 2
Age‐dependent reduction of bone mass in Tg2576 mice. (A) µCT images of femurs isolated from 2‐ and 8 month‐old control C57BL/6 (WT) and Tg2576 male mice. (B) Cross‐section images at the position (red line) of femurs shown in (A). Note a reduction of bone volume in 2‐month‐old but not in 8‐month‐old Tg2576 femurs. (C) Three‐dimensional images of trabecular bones of femurs (metaphyseal region) and spines from 2‐ and 8‐month‐old WT and Tg2576 mice. (D,E) Quantitative analysis of the ratio of BV/TV of trabecular bones at metaphyses (D) and spines (E). Again, a reduction in bone volume of trabecular bones was noted in 2‐month‐old but not 8‐month‐old Tg2576 metaphyseal regions of femurs (D). In spines, bone volume was reduced in both 2‐ and 8‐month‐old Tg2576 mice (E). tb, trabecular bone. (F) PIXImus densitometric analysis of the BMD of whole bone mass (total), spines, and femurs from 12‐month‐old WT and Tg2576 mice. Mean ± SD from 3 different animals (n = 3) are shown. *p < .05, a significant difference from the WT control (Student's t‐test).
Figure 3
Figure 3
Transient increase of in vitro osteoclastogenesis in BMMs derived from Tg2576 mice. (A) Tartrate‐resistant acid phosphatase (TRAP) staining analysis of in vitro osteoclastogenesis from BMMs derived from WT and Tg2576 mice at indicated days of RANKL (100 ng/mL) treatment. BMMs at the same density (5 × 105/well) from 1‐month‐old WT and Tg2576 mice were cultured for 3 days in the presence of 10% M‐CSF. RANKL (100 ng/ml) was then added for the indicated days. (B) Quantitative analysis of the average TRAP activity during in vitro osteoclastogenesis for the indicated days. D2, day 2 of RANKL treatment. (C) Quantitative analysis of the average TRAP activity of in vitro osteoclastogenesis using a high (5 × 105/well) and a low (105/well) density of BMMs from 1‐month‐old WT and Tg2576 mice. Data obtained are from day 4 culture. In (B,C), BMMs were treated with 100 ng/mL RANKL. Means ± SD from 3 different cultures (n = 3) are shown. *p < .05, a significant difference from WT (Student's t‐test). (D,E) In vitro resorptive activity in WT and APPswe‐OCs cultured for 4 and 8 days after RANKL treatment. The resorbing activity was quantified based on total resorbing area, which is normalized by WT control (E). Mean ± SD from 2 different experiments (n = 2) are shown. *p < .05, a significant difference from WT control (Student's t‐test). (F) Relatively normal osteoclast morphology was revealed by TRAP and phalloidin staining analyses. Cells were cultured in the presence of RANKL (100 ng/mL) for 10 days (D10).
Figure 4
Figure 4
Transient increase of in vitro osteoclastogenesis by exogenous Aβ. (A,B) Dose‐dependent Aβ effect on RANKL‐induced osteoclastogenesis. BMMs (5 × 105/well) were treated with 44 ng/mL M‐CSF, 100 ng/mL RANKL, and indicated doses of Aβ for 3 days. The images are shown in (A), and the tartrate‐resistant acid phosphatase (TRAP) activity is quantified and illustrated in (B). Note that Aβ (0.1–0.5 µM) enhanced RANKL induced TRAP activity (*p < .05, a significant difference from WT control). (C,D) Dose‐dependent Aβ effect on in vitro osteoclastogenesis in the presence of permissive concentration of RANKL (10 ng/mL). Note that 1 µM Aβ increased TRAP activity significantly (*p < .05, a significant difference from WT control). (E,F) Time‐dependent Aβ effect on osteoclastogenesis. BMMs were treated with 44 ng/mL M‐CSF, 10 ng/mL RANKL, and 1 µM Aβ for the indicated days. The images are shown in (E), and the TRAP activity is quantified and illustrated in (F). Note that Aβ increased RANKL‐induced TRAP activity only at day 3 (*p < .05, a significant difference from WT control). In (A) to (E), all of the cultures were stained for TRAP activity. Each condition had three replicates (wells). A representative area of the cultures from each condition is shown.
Figure 5
Figure 5
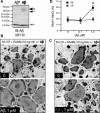
Failure to increase OC formation by Aβ “monomers.” (A) “Oligomeric” and “monomeric” Aβs were revealed by Western blot analysis using 6E10 antibody. Biotin‐conjugated Aβ42 peptides (50 µg/mL) were filtered through the membrane. Equal volumes of filtered and unfiltered Aβs were loaded onto the SDS‐PAGE. Aβ = unfiltered Aβ, which contains both oligomeric (indicated by black arrows) and monomeric forms; Aβ* = filtered/monomeric form indicated by a gray arrow. (B,C) 1 µM Aβ (B), but not the “monomeric” form of Aβ* (C), promotes OC formation from BMMs in the presence of a permissive concentration of RANKL. Tartrate‐resistant acid phosphatase (TRAP) staining images at day 3 culture are shown. (D) Quantification of TRAP+ multinucleated cells based on data from (B,C). Mean ± SD from 3 different experiments (n = 3) are shown. *p < .05, a significant difference from Aβ* treatment (Student's t‐test).
Figure 6
Figure 6
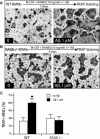
Requirement of RAGE for Aβ‐induced OC formation. (A,B) Aβ (at 1 µM) induced osteoclastogenesis in BMMs (105/well) from WT (A) and RAGE−/− (B) mice in the presence of a permissive concentration of RANKL. Aβ stimulates osteoclastogenesis in WT but not in RAGE−/− BMMs. (C) Quantitative analysis of the average tartrate‐resistant acid phosphatase (TRAP) activity during in vitro osteoclastogenesis. Mean ± SD (n = 3) are shown. *p < .05, a significant difference from control (without Aβ treatment) (Student's t‐test).
Figure 7
Figure 7
Age‐dependent increase of sRAGE in Tg2576 bone marrow. (A) Western blot analysis of RAGE protein in pellet and supernatant of bone marrow flushed from WT and Tg2576 femurs at indicated age. RAGE was detected in large part in supernatant and increased in aged (8‐month) bone marrow, as indicated by the quantification analysis shown in the right panel. In addition, a further increase in Tg2576 bone marrow supernatant was observed (# p < .05, a significant difference from WT control). (B) Western blot analysis of RAGE protein in lysates of BMMs and OCs from WT and Tg2576 mice. The quantification analysis is shown in the right panel (# p < .05, a significant decrease in lysates of BMMs and OCs from Tg2576 mice). (C) Western blot analysis of RAGE protein in lysates and medium of BMMs from WT and Tg2576 mice. A reduction of RAGE in lysates but an increase in the medium of BMMs from Tg2576 mice was observed. (D) Increase of RAGE shedding in HEK293‐APPswe cells. Full‐length RAGE was transiently transfected into HEK293 and HEK293‐APPswe stable cells. Cell lysates and medium were subjected to SDS‐PAGE and immunoblotting analysis. (E) Illustration of a model for sRAGE generation in APPswe‐expressing cells by RAGE ectodomain shedding.
Figure 8
Figure 8
RANKL regulation of RAGE and sRAGE protein levels in BMMs and OCs. (A,B) Decrease in OC formation in APPswe‐BMM culture by permissive concentration of RANKL (10 to 50 ng/mL). BMMs from WT and Tg2576 mice (2 months old) were cultured at low density (105/well) and treated with different doses of RANKL with 1% of M‐CSF. Images of tartrate‐resistant acid phosphatase (TRAP) staining analysis at day 5 culture were shown in (A), and TRAP activity is quantified (mean ± SD, n = 3) and illustrated in (B). *p < .05, a significant difference from WT control. (C) Dose‐ and time‐dependent increase of RAGE protein in BMMs by RANKL. Lysates of BMMs and BMMs incubated with indicated concentrations of RANKL for indicated days were subjected for Western blot analysis using indicated antibodies. (D) Decrease of medium RAGE (sRAGE) by RANKL. Lysates and medium of BMMs and BMMs treated with RANKL were subjected to Western blot analysis of RAGE/sRAGE. RANKL increase of RAGE protein in lysates but decrease of sRAGE in medium were quantified and summarized in (E).
Figure 9
Figure 9
sRAGE inhibition of RANKL‐induced osteoclastogenesis in vitro. (A,B) Dose‐dependent inhibition of RANKL‐induced in vitro osteoclastogenesis by recombinant sRAGE. BMMs were treated with 44 ng/mL M‐CSF, 100 ng/mL RANKL, and indicated doses of the sRAGE for 5 days. The images are shown in (A), and the tartrate‐resistant acid phosphatase (TRAP) activity is quantified and illustrated in (B). Mean ± SD from 3 different experiments are shown. *p < .05, a significant difference from the control (without sRAGE). (C) Western blot analysis of sRAGE from conditioned medium of RAGE‐expressing cells (recombinant sRAGEs were used loading controls). (D,E) Inhibition of in vitro osteoclastogenesis by RAGE conditioned medium (RAGE‐CM). TRAP staining images are shown in (D), and the TRAP activity is quantified and shown in (E). Means ± SD from 3 different experiments are shown. *p < .05, significant difference from the control.
Figure 10
Figure 10
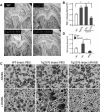
Effect of intraperitoneal administration of sRAGE on OC formation in 2‐month‐old Tg2576 mice. (A,B) Tartrate‐resistant acid phosphatase (TRAP) staining analysis of OCs in femurs of 2‐month‐old WT and Tg2576 mice systemic treated without or with sRAGE or PBS. The data are quantified and illustrated in (B). Bars show the mean ± SEM. *p < .05, a significant increase compared with WT control. # p < .05, a significant decrease compared with PBS treatment. (C) TRAP staining analysis of osteoclastogenesis of BMMs from 2‐month‐old WT and Tg2576 mice injected with sRAGE or PBS. RANKL (100 ng/mL) was used to induce osteoclast formation. (D) Quantitative analysis of the average TRAP activity during in vitro osteoclastogenesis (data from C). Mean ± SD (n = 3) are shown. # p < .05, a significant decrease between sRAGE and PBS treatments (Student's t‐test).
Figure 11
Figure 11
A working model for APPswe/Aβ regulation of OC differentiation and function in an age‐dependent manner.

Similar articles

Cited by

References

    1. Rockenstein E, Crews L, Masliah E. Transgenic animal models of neurodegenerative diseases and their application to treatment development. Adv Drug Deliv Rev. 2007;59:1093–1102. - PubMed
    1. Hsiao KK, Borchelt DR, Olson K, et al. Age‐related CNS disorder and early death in transgenic FVB/N mice overexpressing Alzheimer amyloid precursor proteins. Neuron. 1995;15:1203–1218. - PubMed
    1. Yankner BA, Lu T. Amyloid beta‐protein toxicity and the pathogenesis of Alzheimer's disease. J Biol Chem. 2009;284:4755–4759. - PMC - PubMed
    1. Tysiewicz‐Dudek M, Pietraszkiewicz F, Drozdzowska B. Alzheimer's disease and osteoporosis: common risk factors or one condition predisposing to the other? Ortop Traumatol Rehabil. 2008;10:315–323. - PubMed
    1. Melton LJ 3rd, Beard CM, Kokmen E, Atkinson EJ, O'Fallon WM. Fracture risk in patients with Alzheimer's disease. J Am Geriatr Soc. 1994;42:614–619. - PubMed

Publication types

MeSH terms

Substances