

Impact of maturational status on the ability of osteoblasts to enhance the hematopoietic function of stem and progenitor cells
- PMID: 21542011
- PMCID: PMC3179304
- DOI: 10.1002/jbmr.302
Impact of maturational status on the ability of osteoblasts to enhance the hematopoietic function of stem and progenitor cells
Abstract
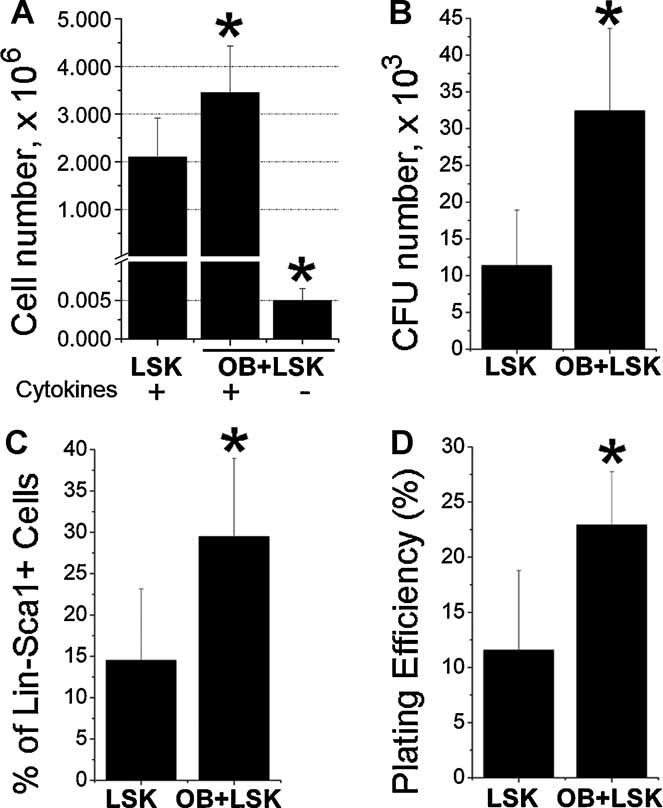
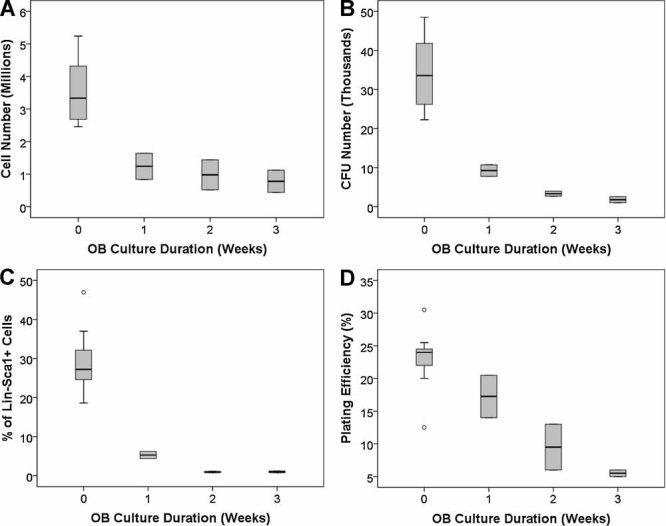
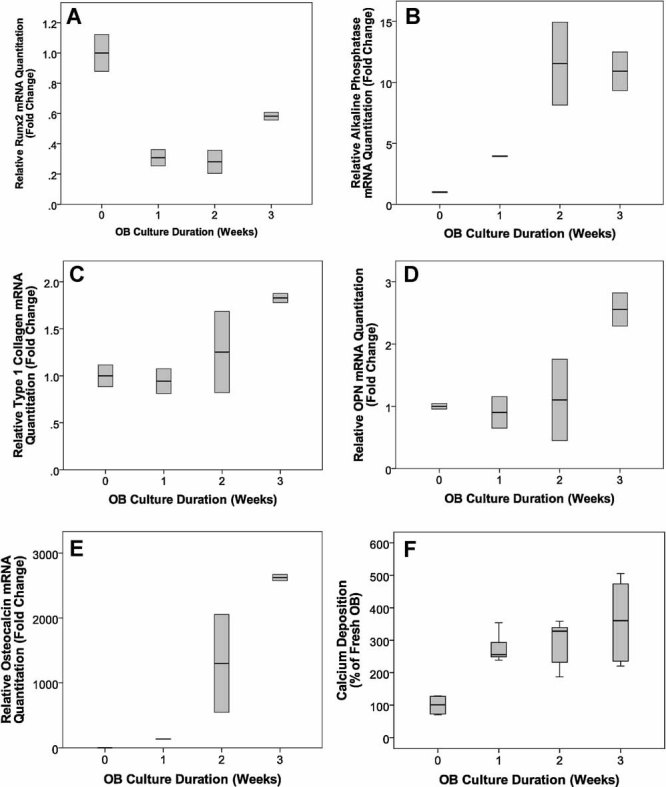
Osteoblasts (OBs) exert a prominent regulatory effect on hematopoietic stem cells (HSCs). We evaluated the difference in hematopoietic expansion and function in response to co-culture with OBs at various stages of development. Murine calvarial OBs were seeded directly (fresh) or cultured for 1, 2, or 3 weeks prior to seeding with 1000 Lin-Sca1 + cKit+ (LSK) cells for 1 week. Significant increases in the following hematopoietic parameters were detected when comparing co-cultures of fresh OBs to co-cultures containing OBs cultured for 1, 2, or 3 weeks: total hematopoietic cell number (up to a 3.4-fold increase), total colony forming unit (CFU) number in LSK progeny (up to an 18.1-fold increase), and percentage of Lin-Sca1+ cells (up to a 31.8-fold increase). Importantly, these studies were corroborated by in vivo reconstitution studies in which LSK cells maintained in fresh OB co-cultures supported a significantly higher level of chimerism than cells maintained in co-cultures containing 3-week OBs. Characterization of OBs cultured for 1, 2, or 3 weeks with real-time PCR and functional mineralization assays showed that OB maturation increased with culture duration but was not affected by the presence of LSK cells in culture. Linear regression analyses of multiple parameters measured in these studies show that fresh, most likely more immature OBs better promote hematopoietic expansion and function than cultured, presumably more mature OBs and suggest that the hematopoiesis-enhancing activity is mediated by cells present in fresh OB cultures de novo.
Copyright © 2011 American Society for Bone and Mineral Research.
Figures

Similar articles
-
Hematopoietic cell regulation of osteoblast proliferation and differentiation.Curr Osteoporos Rep. 2011 Jun;9(2):96-102. doi: 10.1007/s11914-011-0048-1. Curr Osteoporos Rep. 2011. PMID: 21360286 Free PMC article. Review.
-
Megakaryocyte and Osteoblast Interactions Modulate Bone Mass and Hematopoiesis.Stem Cells Dev. 2018 May 15;27(10):671-682. doi: 10.1089/scd.2017.0178. Stem Cells Dev. 2018. PMID: 29631496 Free PMC article.
-
Impact of interactions of cellular components of the bone marrow microenvironment on hematopoietic stem and progenitor cell function.Blood. 2010 Apr 22;115(16):3239-48. doi: 10.1182/blood-2009-09-246173. Epub 2010 Feb 12. Blood. 2010. PMID: 20154218 Free PMC article.
-
Hierarchical organization of osteoblasts reveals the significant role of CD166 in hematopoietic stem cell maintenance and function.Bone. 2013 May;54(1):58-67. doi: 10.1016/j.bone.2013.01.038. Epub 2013 Jan 28. Bone. 2013. PMID: 23369988 Free PMC article.
-
Role of the microenvironment of the embryonic aorta-gonad-mesonephros region in hematopoiesis.Ann N Y Acad Sci. 2001 Jun;938:109-16. doi: 10.1111/j.1749-6632.2001.tb03579.x. Ann N Y Acad Sci. 2001. PMID: 11458497 Review.
Cited by
-
CD166 regulates human and murine hematopoietic stem cells and the hematopoietic niche.Blood. 2014 Jul 24;124(4):519-29. doi: 10.1182/blood-2014-03-565721. Epub 2014 Apr 16. Blood. 2014. PMID: 24740813 Free PMC article.
-
Hematopoietic cell regulation of osteoblast proliferation and differentiation.Curr Osteoporos Rep. 2011 Jun;9(2):96-102. doi: 10.1007/s11914-011-0048-1. Curr Osteoporos Rep. 2011. PMID: 21360286 Free PMC article. Review.
-
Interactions between B lymphocytes and the osteoblast lineage in bone marrow.Calcif Tissue Int. 2013 Sep;93(3):261-8. doi: 10.1007/s00223-013-9753-3. Epub 2013 Jul 10. Calcif Tissue Int. 2013. PMID: 23839529 Free PMC article. Review.
-
Direct Reprogramming of Mouse Fibroblasts into Functional Osteoblasts.J Bone Miner Res. 2020 Apr;35(4):698-713. doi: 10.1002/jbmr.3929. Epub 2019 Dec 30. J Bone Miner Res. 2020. PMID: 31793059 Free PMC article.
-
Megakaryocyte and Osteoblast Interactions Modulate Bone Mass and Hematopoiesis.Stem Cells Dev. 2018 May 15;27(10):671-682. doi: 10.1089/scd.2017.0178. Stem Cells Dev. 2018. PMID: 29631496 Free PMC article.
References
-
- Schofield R. The relationship between the spleen colony-forming cell and the haemopoietic stem cell. Blood Cells. 1978;4:7–25. - PubMed
-
- Vaughan J. Osteogenesis and haematopoiesis. Lancet. 1981;2:133–136. - PubMed
-
- Nilsson SK, Johnston HM, Coverdale JA. Spatial localization of transplanted hemopoietic stem cells: inferences for the localization of stem cell niches. Blood. 2001;97:2293–2299. - PubMed
-
- Gekas C, Dieterlen-Lievre F, Orkin SH, Mikkola HK. The placenta is a niche for hematopoietic stem cells. Dev Cell. 2005;8:365–375. - PubMed
-
- Mikkola HK, Gekas C, Orkin SH, Dieterlen-Lievre F. Placenta as a site for hematopoietic stem cell development. Exp Hematol. 2005;33:1048–1054. - PubMed
Publication types
MeSH terms
Substances
Grants and funding
LinkOut - more resources
Full Text Sources
Medical
Miscellaneous
