. 2011 Jun 6;50(24):5473-7.
doi: 10.1002/anie.201101632. Epub 2011 May 3.

Generation of hot spots with silver nanocubes for single-molecule detection by surface-enhanced Raman scattering

Affiliations

Generation of hot spots with silver nanocubes for single-molecule detection by surface-enhanced Raman scattering

Matthew Rycenga et al. Angew Chem Int Ed Engl. .

Abstract

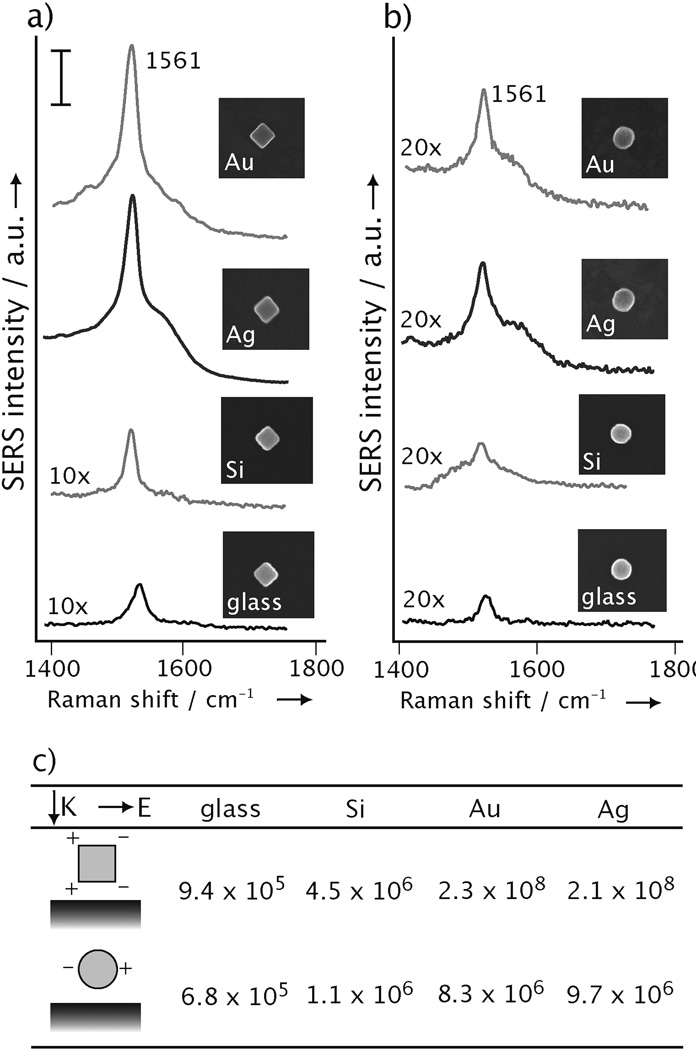
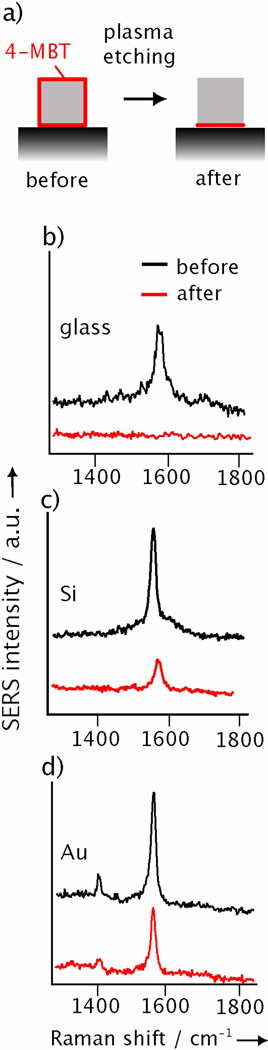
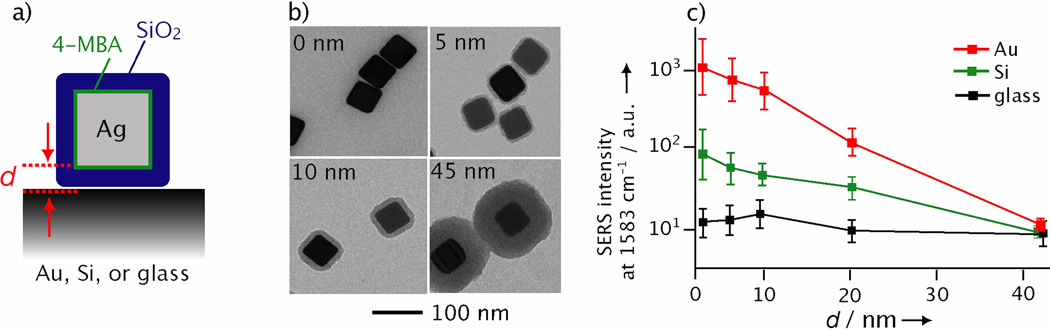
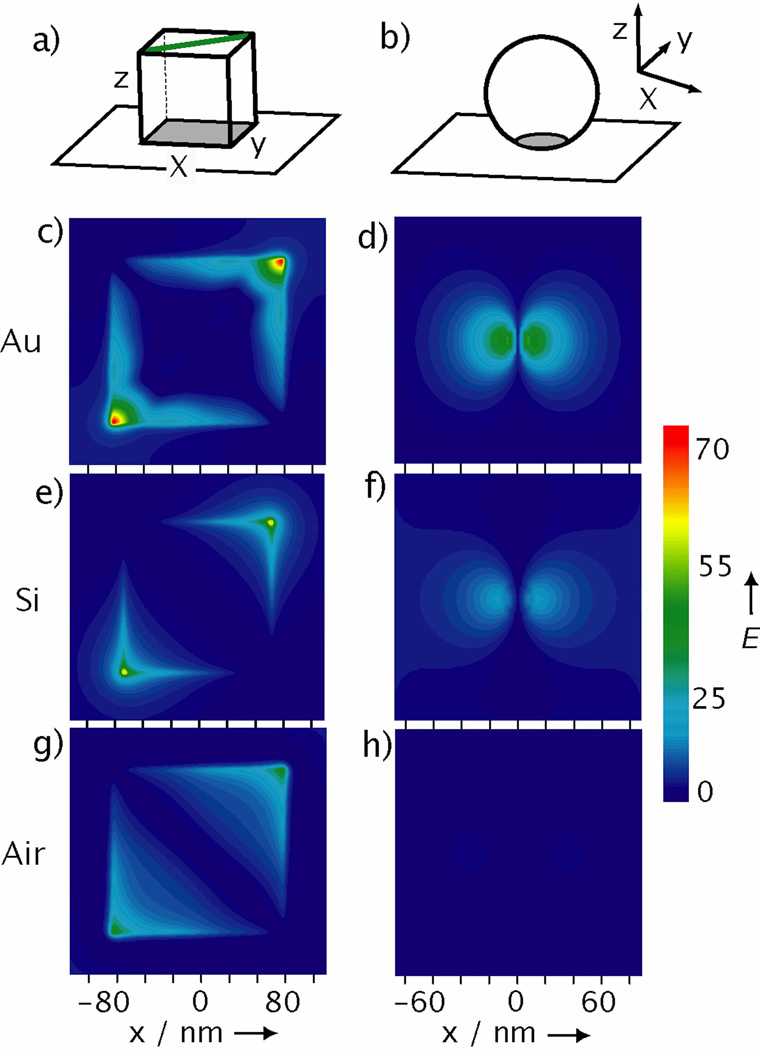
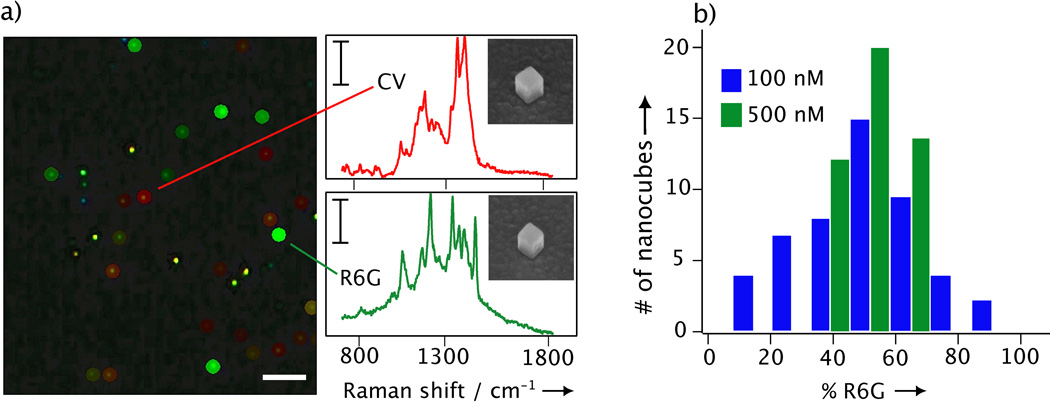
This paper presents a simple strategy for the formation of surface-enhanced Raman scattering (SERS) hot spots, or regions with extraordinary large electric-field enhancements, by depositing a silver nanocube on a metal substrate. Our experimental and theoretical results show that hot spots form at the corners of a nanocube in contact with the substrate and the hot spots derived from a single silver nanocube are capable of detecting SERS from a single molecule. By varying the electrical property of the substrate, and the distance between the nanoparticle and the substrate, we show that the substrate can dramatically affect the SERS from a supported nanoparticle. In addition, by comparing the SERS for nanocubes and nanospheres of similar sizes, we show that this effect is also sensitive to the shape of the supported nanoparticle, and enhancement factors of 9.7×10⁶ and 2.1×10⁸ were obtained for a nanosphere and a nanocube on a metal substrate, respectively. This new approach requires minimum fabrication efforts and offers great simplicity for the formation of robust and fully accessible hot spots, providing an effective SERS platform for single-molecule detection.


Figures

Figure 1
Figure 1
The SERS spectra of 1,4-BDT from: a) nanocubes 106±5 nm in edge length and b) nanospheres 97±7 nm in diameter, on a Au film, Ag film, Si wafer, and glass cover slip, respectively. The insets show their corresponding SEM images. The scale bar for the SERS spectra is 10 adu mW−1 s−1. c) The EFs for single Ag nanocubes and nanospheres, respectively, supported on different substrates. Each value reported in this table represents an average of the data from 40 particles. The cartoon shows propagation and polarization directions of the laser used in this study and simplified distribution of dipolar charges on each type of particle.
Figure 2
Figure 2
a) Schematic showing the selective removal of 4-MBT molecules (red) from the surface of a Ag nanocube supported on a substrate. Plasma etching with O2 can remove the exposed molecules on the particle’s surface, leaving behind molecules at the nanocube-substrate interface. SERS spectra taken from Ag nanocubes functionalized with 4-MBT (with a peak at 1592 cm−1) and then deposited on: glass, b); on Si, c); and on Au microplate substrates, d). The SERS spectra were recorded from the same nanocube before and after plasma etching.
Figure 3
Figure 3
a) Schematic showing how the gap distance (d) between a Ag nanocube and its underlying substrate is controlled by the thickness of the SiO2 shell (blue). The nanocube was functionalized with SERS-active 4-MBA (green) prior to coating with SiO2. b) TEM images of Ag nanocubes coated with SiO2 shells of 0, 5, 10, and 45 nm, respectively, in thickness. c) Plots of SERS peak intensity as a function of thickness for the SiO2 shell. The peak intensities at 1583 cm−1 were recorded for the 4-MBA molecules on single nanocubes supported on Au film, Si wafer, and glass substrates, respectively.
Figure 4
Figure 4
Simulated E-field enhancements for a Ag nanocube or nanosphere. a-b) Schematic of the coordination systems for calculating the E-field enhancement distribution of a nanocube and nanosphere, respectively, positioned 2 nm above a substrate. The grey region represents the plane plotted in the simulations and is 1 nm above the underlying substrate. For nanocube, the polarization was along the green line. The E-field enhancement distributions calculated using the DDA method for: nanocubes c) on Au, e) on Si, and g) in air; as well as for nanospheres d) on Au, f) on Si, and h) in air.
Figure 5
Figure 5
a) Dark-field optical micrograph of Ag nanocubes on a Ag film, with a SERS color map overlay to mark the SERS spectra uniquely from CV (red) or R6G (green). The other colors indicate that the spectra were a combination of both dyes. The scale bars are 10 µm and 8 adu mW−1 s−1, respectively, for the dark-field image and SERS spectra. The inset show SEM images (at a tilt angle of 45°) of the nanocubes from which the two spectra were recorded. b) Histogram of the percentage the SERS spectrum from a nanocube was characterized as R6G (PR6G) at concentrations of 100 nM and 500 nM. The SERS spectra were acquired with 514 nm excitation, 1 s acquisition, and 0.5 mW laser power.

References

    1. Haynes CL, McFarland AD, Van Duyne RP. Anal. Chem. 2005;77:338.
    1. Ru EL, Etchegoin P. Principles of Surface Enhanced Raman Spectroscopy. Elsevier; 2009.
    1. Dieringer JA, Lettan RB, Scheidt KA, Van Duyne RP. J. Am. Chem. Soc. 2007;129:16249. - PubMed
    1. Kinnan MK. J. Chumanov, Phys. Chem. C. 2007;111:18010. G.
    1. Kim K, Yoon JK. J. Phys. Chem. B. 2005;109:20731. - PubMed

Publication types

MeSH terms

LinkOut - more resources