Review
. 2011 Oct;12(10):1517-29.
doi: 10.2174/138920111798357311.

Advanced mass spectrometry-based methods for the analysis of conformational integrity of biopharmaceutical products

Affiliations
Review

Advanced mass spectrometry-based methods for the analysis of conformational integrity of biopharmaceutical products

Cedric E Bobst et al. Curr Pharm Biotechnol. 2011 Oct.

Abstract

Mass spectrometry has already become an indispensable tool in the analytical armamentarium of the biopharmaceutical industry, although its current uses are limited to characterization of covalent structure of recombinant protein drugs. However, the scope of applications of mass spectrometry-based methods is beginning to expand to include characterization of the higher order structure and dynamics of biopharmaceutical products, a development which is catalyzed by the recent progress in mass spectrometry-based methods to study higher order protein structure. The two particularly promising methods that are likely to have the most significant and lasting impact in many areas of biopharmaceutical analysis, direct ESI MS and hydrogen/deuterium exchange, are focus of this article.


Figures
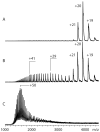
Figure 1
Figure 1
ESI mass spectra of an 80 kDa protein bovine transferrin acquired under near-native (10mM ammonium acetate, pH 7.0, panel (A)), mildly denaturing (10 mM ammonium acetate, pH adjusted to 5.0, panel (B)) and strongly denaturing (water/methanol/acetic acid, 47:50:3, v:v:v, panel (C)) conditions. Emergence of non-native (partially unfolded) states is evident in (B) as the charge state distribution becomes bimodal. Further unfolding of the protein (population of significantly less compact states) is manifested in (C) by a dramatic increase of the abundance of highly charged protein ions. Reproduced with permission from [68].
Figure 2
Figure 2
Nano-ESI mass spectra (inset contains the deconvoluted spectra) of 6 μM GCase (blue) and GCase-ox (red) solutions in 50mM ammonium acetate, pH 4.5. The gray trace shows a reference mass spectrum of GCase under denaturing conditions (50% acetonitrile, 5% acetic acid). Reproduced with permission from [26].
Figure 3
Figure 3
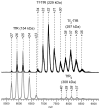
Nano-ESI MS of TfR (gray trace) and Tf/TfR mixture (black trace) in 130 mM ammonium acetate/10 mM ammonium bicarbonate solution at pH 7.4. Protein concentrations (where appropriate): TfR, 4 μM, and Tf, 0.5 μM. Each TfR molecule has two Tf binding sites, hence the presence of both 1:1 and 2:1 complexes in the mass spectra (signal corresponding to free Tf can be seen in the mass spectrum of Tf/TfR mixture, indicating that the binding goes to completion under these conditions).
Figure 4
Figure 4
Schematic representation of HDX MS work flow to examine protein stability. The exchange is initiated by placing the unlabeled protein into a D2O-based solvent system (e.g., by a rapid dilution). Unstructured and highly dynamic protein segments undergo fast exchange (blue and red colors represent protons and deutrons, respectively). Following the quench step (rapid solution acidification and temperature drop), the protein loses its native conformation, but the spatial distribution of backbone amide protons and deuterons across the backbone is preserved (all labile hydrogen atoms at side chains undergo fast back-exchange at this step). Rapid clean-up followed by MS measurement of the protein mass reports the total number of backbone amide hydrogen atoms exchanged under native conditions (a global measure of the protein stability under native conditions), as long as the quench conditions are maintained during the sample work-up and measurement. Alternatively, the protein can by digested under the quench conditions using acid-stable protease(s), and LC/MS analysis of masses of individual proteolytic fragments will provide information on the backbone protection of corresponding protein segments under the native conditions.
Figure 5
Figure 5
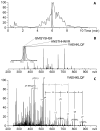
Identification of a fragment peptide produced by peptic digestion of a 60 kDa glycoprotein GCase. A: total ion chromatogram of a peptic digest of unlabeled GCase run under the slow-exchange conditions. B: MS averaged across the time span indicated in panel A with a gray box. The inset in panel B shows a zoomed view of ionic signal at m/z 518; the shaded area shows the 30 ppm confidence interval, and the sequence-based masses of three isobaric peptides fitting in this interval are indicated with a solid black (220-227, YAEHKLQF), solid gray (265-274, GPTLADSTHH) and dotted black (360-368, GMQYSHSII) lines. Reconstructed ions chromatogram of the doubly charged ion at m/z 518.3 is shown in panel A with a gray line. C: a fragmentation mass spectrum (MS/MS) produced upon collision-induced dissociation of the doubly charged ion at m/z 518.
Figure 6
Figure 6
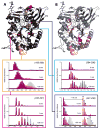
Isotopic distributions of peptide ions representing peptic fragments (185-209, 220-2270, 384-396, and 447-456) of GCase (blue) and GCase-ox (red) following 1 and 100 min of HDX in solution. The gray traces represent isotopic distributions within the same peptide for acid denatured GCase, which allowed for complete exchange (e.g., the maximum level of amide exchange for the peptide) and was analyzed under the same conditions as native GCase. Location of these segments within the crystal structure of GCase is shown in structure A. Local backbone amide protection deduced from HDX MS measurements mapped to GCase structure are colored based on ΔHDX (difference between oxidized and intact forms of GCase, exchange time 100 min) is shown in structure B.
Figure 7
Figure 7
Left: HDX MS within two segments of Tf in the presence (blue) and the absence (red) of the cognate receptor. The exchange was carried out by diluting the protein stock solution 1:10 in exchange solution (100 mM NH4HCO3 in D2O, pH adjusted to 7.4) and incubating for a certain period of time as indicated on each diagram followed by rapid quenching (lowering pH to 2.5 and temperature to near 0°C). The black trace at the bottom of each diagram shows unlabeled protein and the dotted lines represent the end-point of the exchange reaction. Location of these segments in Tf is shown within the context of the low-resolution structure of Tf/TfR [69].

Similar articles

Cited by

References

    1. Walsh G. Biopharmaceutical benchmarks 2010. Nature Biotechnol. 2010;28:917–294. - PubMed
    1. Lundblad RL. Approaches to the Conformational Analysis of Biopharmaceuticals. In: Lundblad RL, editor. Approaches to the conformational analysis of biopharmaceuticals. Boca Raton: CRC Press/Taylor & Francis; 2010.
    1. Kaltashov IA, Eyles SJ. Studies of biomolecular conformations and conformational dynamics by mass spectrometry. Mass Spectrom Rev. 2002;21:37–71. - PubMed
    1. Zhang Z, Pan H, Chen X. Mass spectrometry for structural characterization of therapeutic antibodies. Mass Spectrom Rev. 2009;28:147–176. - PubMed
    1. Srebalus-Barnes CA, Lim A. Applications of mass spectrometry for the structural characterization of recombinant protein pharmaceuticals. Mass Spectrom Rev. 2007;26:370–388. - PubMed

Publication types