. 2011 Sep;164(2b):694-703.
doi: 10.1111/j.1476-5381.2011.01464.x.

Paeoniflorin suppresses the expression of intercellular adhesion molecule-1 (ICAM-1) in endotoxin-treated human monocytic cells

Affiliations

Paeoniflorin suppresses the expression of intercellular adhesion molecule-1 (ICAM-1) in endotoxin-treated human monocytic cells

Lei Jin et al. Br J Pharmacol. 2011 Sep.

Abstract

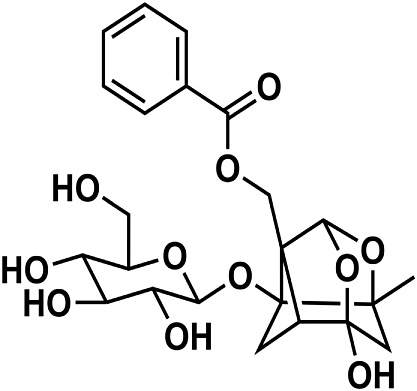
Background and purpose: Paeoniflorin (PF) has ameliorative effects on learning and memory impairment and cerebral ischaemia in rats and has protective effects against the degeneration of dopaminergic neurons in substantia nigra. The neuroprotective effects of PF are most probably derived from its anti-inflammatory property. Abnormally high levels of intercellular adhesion molecule-1 (ICAM-1) have been found to be associated with a wide range of inflammatory and immune responses. Here we studied whether PF regulates the levels of ICAM-1 elevated in LPS-activated differentiated human monocytic U937 cells and TNF-α-stimulated human umbilical vein endothelial cells (HUVECs).

Experimental approach: mRNA levels were evaluated by RT-PCR. Protein levels were evaluated by Western blot analysis. An immunofluorescence technique was used to estimate NF-κB translocation, and NF-κB binding to nuclear DNA was determined by EMSA.

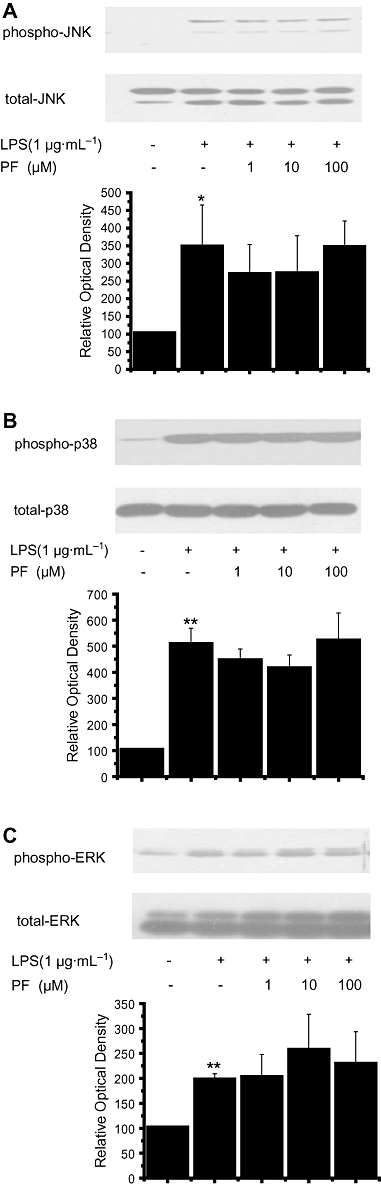
Key results: PF inhibited ICAM-1 expression elevated in LPS-induced U937 cells and TNF-α-stimulated HUVECs. Although previous reports showed that PF's action is mediated by activating adenosine A₁ receptors, application of a selective adenosine A₁ receptor antagonist did not change the inhibitory effect of PF in our experiments. To elucidate the underlying mechanisms of the effect of PF, we studied its effect on signalling pathways upstream of ICAM-1 expression. PF suppressed the activation of the NF-κB pathway, which regulates the expression of ICAM-1. The TLR4 and MAPK pathways were shown not to be involved in the effects of PF in these cells.

Conclusions and implications: PF inhibits ICAM-1 expression in LPS-treated U937 cells and TNF-α-stimulated HUVECs by suppressing the activation of the NF-κB pathway.


Figures

Figure 1
Figure 1
Chemical structure of PF.
Figure 2
Figure 2
Effect of PF on ICAM-1 mRNA transcription and protein expression in LPS-treated U937 cells. After pretreatment with PF for 1 h, PMA-differentiated U937 cells were treated with 1 µg·mL −1 LPS for 3 h. Total RNA was extracted and reverse-transcribed. ICAM-1 mRNA levels were assessed by RT-PCR (A). The level of ICAM-1 mRNA was presented as percentage of ICAM-1 to GAPDH. ICAM-1 expression was measured by Western blot after LPS treatment for 6 h (B). Control refers to no treatment group, and LPS refers to LPS alone group. n = 3. Mean ± SD. **P < 0.01 versus control; #P < 0.05, ##P < 0.01 versus LPS.
Figure 3
Figure 3
Effect of PF on ICAM-1 expression was not influenced by adenosine receptor antagonists. Adenosine A1 receptor antagonist DPCPX (A) and adenosine A2A receptor antagonist ZM241385 (B) were used to evaluate the mechanisms of PF action. Adenosine receptor antagonists were added for 30 min prior to PF treatment. After incubation with PF for 1 h, U937 cells were stimulated by 1 µg·mL −1 LPS for 6 h. Then ICAM-1 protein levels were measured by Western blot. Control refers to no treatment group, and LPS refers to LPS alone group. n = 3. Mean ± SD. **P < 0.01 versus control; ##P < 0.01 versus LPS.
Figure 4
Figure 4
Effect of PF on LPS-induced IKK phosphorylation and IκB degradation in U937 cells. After pretreatment with PF for 1 h, cytoplasm extracts were analysed 30 min after stimulation with 1 µg·mL −1 LPS. The amount of phosphor-IKK (A) and IκB (B) were detected by Western blot. Control refers to no treatment group, and LPS refers to LPS alone group. n = 3. Mean ± SD. **P < 0.01 versus control; #P < 0.05, ##P < 0.01 versus LPS.
Figure 5
Figure 5
Effect of PF on LPS-induced nuclear translocation of NF-κB in U937 cells. After pre-incubation with PF for 1 h, U937 cells were treated with 1 µg·mL−1 LPS for 1 h. Then immunofluorescence and confocal microscopy analysis were used. (1) Control; (2) 1 µg·mL−1 LPS treatment for 1 h; (3) PF 100 µM pretreatment for 1 h before the addition of LPS. a, b and c were green labelling for NF-κB/p65, red labelling for nucleus and the combined figure respectively. When NF-κB entered the nucleus, the combined figure would give rise to the yellow colour. Results are representative of three independent experiments.
Figure 6
Figure 6
Effect of PF on LPS-induced NF-κB binding to nuclear DNA in U937 cells. After pre-incubation with PF for 1 h, U937 cells were treated with 1 µg·mL −1 LPS for 1 h. Then the nuclear extracts were obtained and incubated with biotin-labelled oligonucleotides containing NF-κB consensus sequence for analysis. Lane 1, free probe alone (no nuclear extract); lane 2, no treatment group; lane 3, LPS alone; lanes 4, 5 and 6, 1, 10 and 100 µM PF plus LPS, respectively; lane 7, LPS plus 100-fold unlabelled oligonucleotides. Results are representative of three independent experiments.
Figure 7
Figure 7
Effect of PF on LPS-induced MAPK pathway activation in U937 cells. After pretreatment with PF for 1 h and subsequent stimulation with 1 µg·mL −1 LPS for 30 min, cytoplasm extracts were obtained. The amount of JNK phosphorylation (A), p38 MAPK phosphorylation (B) and ERK phosphorylation (C) were detected by Western blot. Control refers to no treatment group. n = 3. Mean ± SD. *P < 0.05, **P < 0.01 versus control.
Figure 8
Figure 8
Effect of PF on ICAM-1 expression in TNF-α-stimulated HUVECs. After pretreatment with PF for 1 h and subsequent stimulation with 25 U·mL −1 TNF-α 30 min for IκB, 6 h for ICAM-1, cytoplasm extracts were obtained. The amount of ICAM-1 (A) and IκB (B) were detected by Western blot. Control refers to no treatment group, and TNF-α refers to TNF-α alone group. n = 3. Mean ± SD. *P < 0.05, **P < 0.01 versus control; #P < 0.05 versus TNF-α.

Similar articles

Cited by

References

    1. Bernot D, Peiretti F, Canault M, Juhan-Vague I, Nalbone G. Upregulation of TNF-alpha-induced ICAM-1 surface expression by adenylate cyclase-dependent pathway in human endothelial cells. J Cell Physiol. 2005;202:434–441. - PubMed
    1. Cotran RS, Mayadas-Norton T. Endothelial adhesion molecules in health and disease. Pathol Biol (Paris) 1998;46:164–170. - PubMed
    1. Dignam JD, Lebovitz RM, Roeder RG. Accurate transcription initiation by RNA polymerase II in a soluble extract from isolated mammalian nuclei. Nucleic Acids Res. 1983;11:1475–1489. - PMC - PubMed
    1. Fitzgerald KA, Rowe DC, Golenbock DT. Endotoxin recognition and signal transduction by the TLR4/MD2-complex. Microbes Infect. 2004;6:1361–1367. - PubMed
    1. Ip WK, Wong CK, Lam CW. Tumour necrosis factor-alpha-induced expression of intercellular adhesion molecule-1 on human eosinophilic leukaemia EoL-1 cells is mediated by the activation of nuclear factor-kappaB pathway. Clin Exp Allergy. 2003;33:241–248. - PubMed

MeSH terms