. 2011 Jun;80(6):1680-98.
doi: 10.1111/j.1365-2958.2011.07677.x. Epub 2011 May 17.

Assembly of the Caulobacter cell division machine

Affiliations

Assembly of the Caulobacter cell division machine

Erin D Goley et al. Mol Microbiol. 2011 Jun.

Abstract

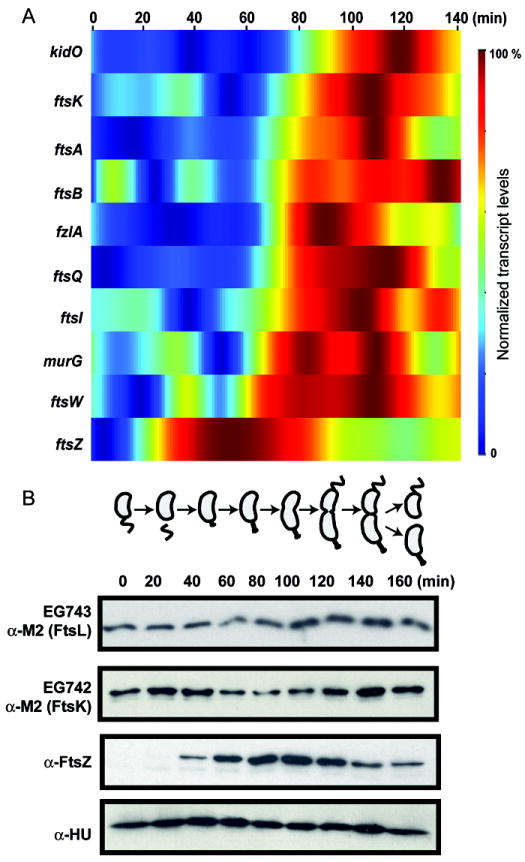
Cytokinesis in Gram-negative bacteria is mediated by a multiprotein machine (the divisome) that invaginates and remodels the inner membrane, peptidoglycan and outer membrane. Understanding the order of divisome assembly would inform models of the interactions among its components and their respective functions. We leveraged the ability to isolate synchronous populations of Caulobacter crescentus cells to investigate assembly of the divisome and place the arrival of each component into functional context. Additionally, we investigated the genetic dependence of localization among divisome proteins and the cell cycle regulation of their transcript and protein levels to gain insight into the control mechanisms underlying their assembly. Our results revealed a picture of divisome assembly with unprecedented temporal resolution. Specifically, we observed (i) initial establishment of the division site, (ii) recruitment of early FtsZ-binding proteins, (iii) arrival of proteins involved in peptidoglycan remodelling, (iv) arrival of FtsA, (v) assembly of core divisome components, (vi) initiation of envelope invagination, (vii) recruitment of polar markers and cytoplasmic compartmentalization and (viii) cell separation. Our analysis revealed differences in divisome assembly among Caulobacter and other bacteria that establish a framework for identifying aspects of bacterial cytokinesis that are widely conserved from those that are more variable.


Figures

Figure 1
Figure 1. Strategy for analysis of the dynamics of divisome assembly
(A) Schematic diagram of Caulobacter divisome proteins and their predicted membrane topologies. IM: inner membrane; OM: outer membrane; PG: peptidoglycan; Fts protein names have been abbreviated by excluding “Fts” from them (e.g. Z = FtsZ, A = FtsA, etc). (B) Schematic representation of the strategy for generating strains expressing fluorescent fusion proteins of interest. (C) Illustration of the localization of MipZ (blue) and a division site localized protein of interest (red) over the cell cycle. Arrows point to the key events we examined: appearance of MipZ bipolarization, localization of protein of interest, initiation of invagination and cell separation. (D) Phase contrast and fluorescence micrographs of cells expressing MipZ-Cer and FtsZ-YFP in strain EG490 over the cell cycle. Cells were grown in PYE media with 0.5 mM vanillate for 1 h prior to synchrony. Cells were withdrawn from cultures at 10 min intervals and visualized by phase contrast and fluorescence microscopy to determine the localizations of fluorescently labeled proteins. Stalked (ST) and swarmer (SW) daughters are indicated. (E) Percentage of cells with visible constrictions, bipolar MipZ-Cer, and FtsZ-YFP localizations near midcell or at the pole were plotted as a function of time during a cell cycle of about 90 min. Protein localization and constriction patterns were examined using synchronized population of strain EG490 as in (D). (F) Percentage of cells with bipolar MipZ-Cer and with visible invagination of the cell envelope as a function of time during the cell cycle for 19 strains bearing inducible fluorescent fusions to divisome proteins. The mean percentage of cells with bipolar MipZ and envelope invagination are plotted in blue and red, respectively. An average of 250 cells were counted at each time point in each strain for each independent synchrony for quantitation of invagination and an average of 190 cells were counted at each time point in each strain for each independent synchrony for quantitation of MipZ localization.
Figure 2
Figure 2. Cell cycle localization dynamics of division site localized fluorescent fusion proteins
Cells expressing YFP, Venus, mCherry or Cerulean fusion proteins were grown in PYE media containing 0.3% xylose for 2 h or 0.5 mM vanillate for 1 h prior to synchrony. The time-course montage shows images of representative cells from each of 19 strains over the cell cycle in intervals of 10 min. Dotted lines represent the outline of the cells for clarity when the cytoplasmic signal is low. Stalked (ST) and swarmer (SW) daughters are indicated. The phase contrast and MipZ-Cer images are from the same cells as the FtsZ-YFP images (EG490).
Figure 3
Figure 3. Polar localization patterns of division site localized proteins
Bar graph depicting percentages of synchronized swarmer cells with polar localization of fluorescent fusions to the indicated proteins. Representative images of the three general classes of localization (pole then midcell, pole and midcell, or midcell only) are shown adjacent to the gray, white, or black bars that denote the indicated localization class in the bar graph. Asterisks next to protein names on the x-axis indicate that the fluorescent fusion was expressed from the native locus, whereas lack of an asterisk indicates an induced fluorescent fusion. Although MreB and TipN (highlighted with stars on the graph) are found at the pole and midcell, their localization patterns are distinct from the others in that class (see Fig. 2 for images).
Figure 4
Figure 4. Temporal order of assembly of divisome proteins at midcell
(A) Raw data for percentage of cells with midcell protein localization from a subset of the 19 strains analyzed. Cells of strains EG420 (PvanA-ftsZ–venus mipZ –cerulean), EG503 (PxylX–venus–zapA mipZ –cerulean), EG519 (PxylX–venus–mreB mipZ –cerulean), EG494 (PxylX–yfp–ftsA mipZ –cerulean), EG493 (PxylX–venus–ftsL mipZ –cerulean), EG501 (PxylX–venus–ftsW mipZ –cerulean), and EG746 (PxylX–tipN–mCherry mipZ –cerulean) were grown and imaged as in Figs 1 and 2. An average of 310 cells were counted at each time point in each strain for each independent synchrony. Percentages of cells with visible midcell localizations of the fusion proteins were plotted as a function of time. The lower panel shows the curves fit to the raw data by applying a sigmoidal dose response curve to calculate the time point at half-maximum localization (dashed line). (B) Time of half-maximum occurrence for midcell recruitment of division-site localized proteins, bipolarization of MipZ, dispersal of MreB, initiation of invagination and degree of invagination. Each point represents an individual synchrony and time-course experiment. Proteins are grouped by color to reflect similar times of occurrence and similar functions. The mean time of half-maximum occurrence (t1/2) and number of replicates (n) for each event are listed on the right.
Figure 5
Figure 5. Timing of midcell localization of endogenously expressed fusion proteins
(A) Cells expressing the indicated Venus or mCherry fusion proteins from their native gene locus were grown in PYE media (the * following the protein name indicates a fluorescent fusion expressed from the native gene locus, as opposed to the inducible fusions used in Figs. 2 and 4). The time-course montage shows images of representative cells from each strain over the cell cycle in intervals of 10 min. Dotted lines represent the outline of the cells for clarity when the cytoplasmic signal is low. Stalked (ST) and swarmer (SW) daughters are indicated. The phase contrast and MipZ-Cer images are from the same cells as the ZapA*-mCherry images (EG697). (B) Time at half-maximum midcell localization for 5 endogenously expressed fusion proteins (indicated by the *) and their xylose-induced counterparts from (Fig. 4B). At least two independent time-course experiments were performed for each strain and an average of 310 cells were counted at each time point for each strain for each independent synchrony. The mean time of half-maximum occurrence (t1/2) and number of replicates (n) for each event are listed on the right.
Figure 6
Figure 6. Pairwise comparison of division-site localized proteins in the same cells
Representative images of phase contrast and fluorescence microscopy of strains (A) EG699 (zapA-mCherry yfp-ftsE), (B) EG654 (zapA-cfp mCherry-fzlA), (C) EG658 (venus-ftsI ftsK-mCherry), (D) EG689 (venus-ftsI PvanA-mCherry-ftsW), (E) EG692 (PxylX–yfp–ftsA zapA-mCherry) and F) EG690 (PxylX–yfp–ftsA mCherry –ftsW). Images were taken and localization was quantified at the indicated time post-synchrony. Percentage of cells showing neither protein at midcell, both proteins at midcell, and either one or the other at midcell were quantified. SD = standard deviation. For (D), cells were grown in PYE media containing 0.5mM vanillate for 2 h prior synchrony. For (E) and (F), cells were grown in PYE media containing 0.3% xylose for 2 h prior synchrony. In (A)–(F), at least 200 cells from two separate time-course experiments were analyzed. The accumulation of fluorescent fusions at midcell is indicated by arrows.
Figure 7
Figure 7. Genetic dependency of localization among divisome proteins
Representative phase contrast and fluorescence images of fluorescent fusions in the indicated depletion strains are shown. Cells were grown for the indicated amount of time in PYE with xylose inducer (X) or without xylose inducer (with glucose, G) prior to imaging. Expression of the fluorescent fusion of interest was induced by addition of 0.5 mM vanillate when indicated. Arrows highlight strong localization in mutant cells; hatched arrows highlight weak localization in mutant cells.
Figure 8
Figure 8. Cell cycle regulation of transcript and proteins levels of a subset of division-site localized proteins
(A) Normalized abundance of transcript levels of the indicated genes over the cell cycle. For all 19 proteins analyzed for timing of arrival at midcell, we examined their corresponding mRNA profiles. Among these 19 proteins, 10 are cell cycle regulated at the transcript level (represented in the vertical axis). The horizonal axis represents the time (0 to 140 min) measured from the beginning of the cell synchrony. For each of these profiles, we performed a cubic-spline interpolation followed by an affine transformation so that the expression values of each profile ranged between 0 and 100%. We then ordered these 10 genes (vertical axis) according to the time-points at which each reached 50% expression, relative to their peak expression minus basal expression values (the bottom gene, ftsZ, is the first one to reach 50% expression). The different colors in the heat map represent the expression values of each profile, encoded using the color scale shown in the figure (red = peak expression, blue = basal expression). (B) Immunoblots using antibodies against the indicated proteins of cell lysates from synchronized cells of the indicated strains grown in M2G.
Figure 9
Figure 9. Proposed model for divisome assembly in Caulobacter
Division site localized proteins in Caulobacter assemble at midcell in a series of 7 stages. Factors that are enriched at the division site at each stage are depicted graphically, with proteins that assemble approximately simultaneously depicted in the same color. Cellular events that occur in the same time frame are indicated to the left of the images, and the localization of MipZ at each stage is depicted on the right. The final panel shows the complex of proteins that are found at the new cell pole immediately after cell division.

Similar articles

Cited by

References

    1. Aaron M, Charbon G, Lam H, Schwarz H, Vollmer W, Jacobs-Wagner C. The tubulin homologue FtsZ contributes to cell elongation by guiding cell wall precursor synthesis in Caulobacter crescentus. Mol Microbiol. 2007;64:938–952. - PubMed
    1. Aarsman ME, Piette A, Fraipont C, Vinkenvleugel TM, Nguyen-Disteche M, den Blaauwen T. Maturation of the Escherichia coli divisome occurs in two steps. Mol Microbiol. 2005;55:1631–1645. - PubMed
    1. Addinall SG, Cao C, Lutkenhaus J. FtsN, a late recruit to the septum in Escherichia coli. Mol Microbiol. 1997;25:303–309. - PubMed
    1. Addinall SG, Lutkenhaus J. FtsA is localized to the septum in an FtsZ-dependent manner. J Bacteriol. 1996;178:7167–7172. - PMC - PubMed
    1. Anwari K, Poggio S, Perry A, Gatsos X, Ramarathinam SH, Williamson NA, et al. A modular BAM complex in the outer membrane of the alpha-proteobacterium Caulobacter crescentus. PLoS ONE. 2010;5:e8619. - PMC - PubMed

Publication types

MeSH terms