. 2011 May 4:6:28.
doi: 10.1186/1750-1326-6-28.

Lack of neuroprotection in the absence of P2X7 receptors in toxin-induced animal models of Parkinson's disease

Affiliations

Lack of neuroprotection in the absence of P2X7 receptors in toxin-induced animal models of Parkinson's disease

Zsuzsanna Hracskó et al. Mol Neurodegener. .

Abstract

Background: Previous studies indicate a role of P2X7 receptors in processes that lead to neuronal death. The main objective of our study was to examine whether genetic deletion or pharmacological blockade of P2X7 receptors influenced dopaminergic cell death in various models of Parkinson's disease (PD).

Results: mRNA encoding P2X7 and P2X4 receptors was up-regulated after treatment of PC12 cells with 1-methyl-4-phenyl-1,2,3,6- tetrahydropyridine (MPTP). P2X7 antagonists protected against MPTP and rotenone induced toxicity in the LDH assay, but failed to protect after rotenone treatment in the MTT assay in PC12 cells and in primary midbrain culture. In vivo MPTP and in vitro rotenone pretreatments increased the mRNA expression of P2X7 receptors in the striatum and substantia nigra of wild-type mice. Basal mRNA expression of P2X4 receptors was higher in P2X7 knockout mice and was further up-regulated by MPTP treatment. Genetic deletion or pharmacological inhibition of P2X7 receptors did not change survival rate or depletion of striatal endogenous dopamine (DA) content after in vivo MPTP or in vitro rotenone treatment. However, depletion of norepinephrine was significant after MPTP treatment only in P2X7 knockout mice. The basal ATP content was higher in the substantia nigra of wild-type mice, but the ADP level was lower. Rotenone treatment elicited a similar reduction in ATP content in the substantia nigra of both genotypes, whereas reduction of ATP was more pronounced after rotenone treatment in striatal slices of P2X7 deficient mice. Although the endogenous amino acid content remained unchanged, the level of the endocannabinoid, 2-AG, was elevated by rotenone in the striatum of wild-type mice, an effect that was absent in mice deficient in P2X7 receptors.

Conclusions: We conclude that P2X7 receptor deficiency or inhibition does not support the survival of dopaminergic neurons in an in vivo or in vitro models of PD.


Figures

Figure 1
Figure 1
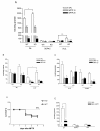
Effect of P2X7 receptor antagonists on cell viability after rotenone and MPTP pretreatment in PC12 cells. A. and B. Expression levels of the P2X7 (A) and P2X4 (B) purinergic receptors in PC12 cells after 1 μM MPTP treatment. Quantitative SYBR Green real-time PCR was performed using specific primers. The experiments were repeated twice with similar results. The expression level of the P2X receptors was normalized to the expression level of the distinct housekeeping gene, 18S rRNA. Data are displayed as the mean ± S.E.M. Asterisks indicate significant differences from the corresponding control (*P < 0.05, Student's t-test). C and D. Concentration-dependent inhibition of cell viability by rotenone (C) and MPTP (D) in the MTT assay. Cells were treated with various concentrations of the toxins ranging from 0.01 μM to 30 μM, and the reduction of MTT into formazan was measured 20 h later. Cell viability is expressed as a percentage of the respective controls. E and F. Effects of BBG and AZ10606120 on toxicity induced by rotenone (E) and MPTP (F) measured in the MTT assay. Cells were pretreated with L-deprenyl and with the P2X7 antagonists, BBG and AZ10606120, in 10 and 100 nM concentrations for 1 h before treatment with 1 μM rotenone or 10 μM MPTP for 20 h. Data are expressed as the percentage of values of control cultures and are the means ± S.E.M. of four experiments. G. and H. Effects of BBG and AZ10606120 on toxicity induced by rotenone (G) and MPTP (H) measured in the LDH assay. Treatments of the cells were identical to the MTT assay. The released LDH is expressed as the percentage of total LDH measured after freeze/thaw lysis of cells. These data are then expressed as the percentage of values of control cultures and are the means ± S.E.M. of four experiments. * P < 0.05, ** P < 0.01, significance vs. controls using an ANOVA followed by the Dunnett test. E-H. Note that the concentration of rotenone and MPTP are indicated in μM, whereas the concentration of other drugs in nM.
Figure 2
Figure 2
Effect of P2X7 receptor antagonists on cell viability after rotenone and MPTP pretreatment in primary substantia nigra (SN) culture. Non-treated SN cultures contained large tyrosine hydroxylase-positive (arrow) neurons that were identified by MAP2 (red; A) and TH (green; B) immunoreactivity (merge; C). Rotenone treatment disrupted the neurons (phase contrast morphology; D and MAP2 immunostaining; E). Scale bar: 20 μm. MAP2+ and TH+ neurons represented 26.28 ± 10.6% and 7.32 ± 2.81% of the total cell number. Total cell number was determined by counting DAPI-positive nuclei on each of 40 microscopic fields. Cells were counted at 250 × (2 × 10 fields) and 500 × (2 × 10 fields) magnification (independent determinations: n = 4). F. and G. Effects of BBG and AZ10606120 on changes in cell viability induced by rotenone (F) and MPTP (G) measured in the MTT assay. Cells were pretreated with L-deprenyl and with the P2X7 antagonists, BBG and AZ10606120, in 10 and 100 nM concentrations for 1 h before treatment with 1 μM rotenone or MPTP for 20 h. Data are expressed as the percentage of values of control cultures and are the means ± S.E.M. of four experiments. *P < 0.05, ** P < 0.01, significance vs. controls using an ANOVA followed by the Dunnett test. Note that the concentration of rotenone and MPTP are indicated in μM, whereas the concentration of other drugs in nM.
Figure 3
Figure 3
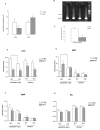
Changes in the mRNA and protein expression of P2X7 and P2X4 receptors in the striatum and substantia nigra obtained from P2X7 receptor wild-type (WT) and P2X7-/- (KO) mice after in vivo MPTP treatment. Mice (6-8 mice per group) were injected i.p. with 4 × 20 mg/kg of MPTP or saline (SAL). A-C. After decapitation, the brains were removed immediately, total RNA extracted from the striatum (A, C) and substantia nigra (B) and then reverse-transcribed to cDNA. Data are displayed as the means ± S.E.M. Asterisks indicate significant differences from the corresponding saline-injected mice or between genotypes as indicated (*P < 0.05, ***P < 0.0001). D, E. and F. Immunofluorescent staining for P2X7 receptor and microglial cells in striatal sections of saline- and MPTP-treated WT and P2X7-/- mice. Merged pictures. Fluorescein-labeled GSL I - isolectin B4 is a marker for endothelial (see stars in picture "F") and microglial cells. P2X7 receptors were labeled with a P2X7-DyLight 549 conjugate (red). Orange means the same localization for both stains. DAPI (in Vectashield mounting medium) labels nuclei (blue). Scale bar: 20 μm. D. Detail of the striatal section of saline-treated WT mouse brain. Inserts (arrows) show the localization of P2X7 receptors in FITC-labeled microglial cells. E. Only microglial cells are labeled (green, insert, arrow) in the striatal section of MPTP-treated WT mouse brain. F. Microglia (arrow, insert) and endothelial cells (stars) are labeled by the isolectin, but no P2X7 immunofluorescence is visible in the striatal sections of saline-treated P2X7-/- mouse brain.
Figure 4
Figure 4
Effect of genetic deletion and pharmacological antagonists of P2X7 receptors on the level of DA and its metabolites in the striatum and animal survival after in vivo MPTP treatment. Wild-type (WT) and P2X7 -/- (KO) mice were treated with saline or with MPTP in doses indicated in the legend (4 × 10-20 mg/kg i. p.) and sacrificed 72 h later. A, B, C and E. Striatal samples were analyzed using HPLC and the amount of (A, E) dopamine (DA) 3,4-dihydroxyphenylacetic acid (DOPAC), homovanillic acid (HVA), (B) norepinephrine (NE), 3-methoxityramine (3-MT) and (C) 5-HT and 5-hydroxyindoleacetic acid (5-HIAA) is expressed in nmol/mg protein (n = 5-8). D. Survival curves of WT and P2X7 -/- (KO) mice subjected to in vivo MPTP (4 × 20 mg/kg i.p.) treatment (n = 16/group). E. Effect of Brilliant blue G (BBG, 50 mg/kg i.p.) pretreatment on the level of DA and its metabolites in the striatum of WT mice after in vivo MPTP (4 × 20 mg/kg) treatment. BBG was injected 18 h before the first MPTP injection. Asterisks indicate significant differences from the corresponding saline-injected mice or between WT and KO mice as indicated (*P < 0.05, ** P < 0.01, *** P < 0.01).
Figure 5
Figure 5
The effect of in vitro rotenone pretreatment on the mRNA expression of P2X7 and P2X4 receptors and the P2X7 (k) splice variant, ATP, ADP and AMP contents and on the energy charge in the substantia nigra and striatal slices of wild-type (WT) and P2X7 receptor knockout (KO) mice. Striatal slices were preincubated with in vitro rotenone (10 μM) for 60 min. (A) Quantitative SYBR Green real-time PCR was performed using specific primers. The experiments were repeated twice with similar results. The expression level of the P2X receptors was normalized to the expression level of the distinct housekeeping gene, 18S rRNA. Data are displayed as the means ± S.E.M. Asterisks indicate significant differences from the corresponding control (*P < 0.05, Student's t-test). B. Confirmation of the expression of the P2X7(k) variant using RT-PCR with specific forward primers for P2X7(k) isoforms and a common reverse primer. RT-PCR analysis showed that P2X7(k)-specific primer pairs produced amplicons are present in striatal slices. The gel is 1.5%, 1× TBE buffer. A 100-bp DNA ladder (Fermentas, Vilnius, Lithuania) was used to identify PCR fragment sizes, and the amplification of 18s RNA was used as an internal control. C. Changes in mRNA expression levels of P2X7(k) variant in the striatum obtained from P2X7 receptor wild-type mice after in vitro rotenone pretreatment. Quantitative SYBR Green real-time PCR was performed using specific primers. The experiments were repeated twice with similar results. The expression level of the P2X7(k) isoform was normalized to the expression level of the distinct housekeeping gene 18S rRNA. Data are displayed as the means ± S.E.M. Asterisks indicate significant differences from the corresponding control (**P < 0.01, Student's t-test). D, E, F. Tissue contents of ATP, ADP and AMP, expressed in nmol/mg protein (n = 5-8). G. For the calculation of energy charge (EC) see Materials and Methods. * P < 0.05, ** P < 0.01, significance vs. control.
Figure 6
Figure 6
DA and its metabolites in striatal slices after rotenone treatment in wild-type (WT) and P2X7 receptor knockout (KO) mice. Samples were analyzed using HPLC, and the amount of (A) dopamine (DA) 3,4-dihydroxyphenylacetic acid (DOPAC), homovanillic acid (HVA), (B) norepinephrine, (NE), 3-methoxityramine (3-MT) and (C) 5-HT and 5-hydroxyindoleacetic acid (5-HIAA) is expressed in nmol/mg protein (n = 5-8). Asterisks indicate significant differences from the corresponding control (*P < 0.05, ** P < 0.01).
Figure 7
Figure 7
The effect of in vitro rotenone pretreatment on EFS-evoked [3H]DA release and on the levels of glutamate (Glu), aspartate (Asp), GABA and of the endocannabinoid 2-AG and anandamide (AEA) in wild-type (WT) and P2X7 receptor knockout (KO) mice. A, B. Slices were perfused with Krebs solution and subjected to electrical field stimulation (25 V, 1 msec, 2 Hz, 240 shocks) during the 3rd and 13th sample collection period (S1, S2) after a 60-min preincubation with rotenone (10 μM, B) or Krebs' solution (A). [3H]DA release is expressed as fractional release (FR%, for calculation see Materials and methods) as a function of time (n = 5-8). C, D. Samples were analyzed using HPLC, and the results are expressed in nmol/mg protein (C) or in pmol/mg protein (D) (n = 5-8). Asterisks indicate significant differences from the corresponding control or between WT and KO mice as indicated (** P < 0.01).

Similar articles

Cited by

References

    1. Franke H, Illes P. Involvement of P2 receptors in the growth and survival of neurons in the CNS. Pharmacol Ther. 2006;109:297–324. doi: 10.1016/j.pharmthera.2005.06.002. - DOI - PubMed
    1. Skaper SD, Debetto P, Giusti P. The P2X7 purinergic receptor: from physiology to neurological disorders. FASEB J. 2010;24:337–345. doi: 10.1096/fj.09-138883. - DOI - PubMed
    1. Sperlagh B, Vizi ES, Wirkner K, Illes P. P2X7 receptors in the nervous system. Prog Neurobiol. 2006;78:327–346. doi: 10.1016/j.pneurobio.2006.03.007. - DOI - PubMed
    1. Surprenant A, North RA. Signaling at purinergic P2X receptors. Annu Rev Physiol. 2009;71:333–359. doi: 10.1146/annurev.physiol.70.113006.100630. - DOI - PubMed
    1. North RA, Surprenant A. Pharmacology of cloned P2X receptors. Annu Rev Pharmacol Toxicol. 2000;40:563–580. doi: 10.1146/annurev.pharmtox.40.1.563. - DOI - PubMed

LinkOut - more resources