Increasing blood glucose variability heralds hypoglycemia in the critically ill
- PMID: 21543086
- PMCID: PMC3154465
- DOI: 10.1016/j.jss.2011.03.008
Increasing blood glucose variability heralds hypoglycemia in the critically ill
Abstract
Background: Control of hyperglycemia improves outcomes, but increases the risk of hypoglycemia. Recent evidence suggests that blood glucose variability (BGV) is more closely associated with mortality than either isolated or mean BG. We hypothesized that differences in BGV over time are associated with hypoglycemia and can be utilized to estimate risk of hypoglycemia (<50 mg/dL).
Materials and methods: Patients treated with intravenous insulin in the Surgical Intensive Care Unit of a tertiary care center formed the retrospective cohort. Exclusion criteria included death within 24 h of admission. We describe BGV in patients over time and its temporal relationship to hypoglycemic events. The risk of hypoglycemia for each BG measurement was estimated in a multivariable regression model. Predictors were measures of BGV, infusions of dextrose and vasopressors, patient demographics, illness severity, and BG measurements.
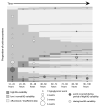
Results: A total of 66,592 BG measurements were collected on 1392 patients. Hypoglycemia occurred in 154 patients (11.1%). Patient BGV fluctuated over time, and increased in the 24 h preceding a hypoglycemic event. In crude and adjusted analyses, higher BGV was positively associated with a hypoglycemia (OR 1.41, P < 0.001). Previous hypoglycemic events and time since previous BG measurement were also positively associated with hypoglycemic events. Severity of illness, vasopressor use, and diabetes were not independently associated with hypoglycemia.
Conclusions: BGV increases in the 24 h preceding hypoglycemia, and patients are at increased risk during periods of elevated BG variability. Prospective measurement of variability may identify periods of increased risk for hypoglycemia, and provide an opportunity to mitigate this risk.
Copyright © 2011 Elsevier Inc. All rights reserved.
Figures


References
-
- Furnary AP. Diabetes, hyperglycemia, and the cardiac surgery patient: introduction. Semin Thorac Cardiovasc Surg. 2006;18(4):278–80. - PubMed
-
- Furnary AP, Wu Y. Clinical effects of hyperglycemia in the cardiac surgery population: the Portland Diabetic Project. Endocr Pract. 2006;12(Suppl 3):22–6. - PubMed
-
- Egi M, et al. Blood glucose concentration and outcome of critical illness: the impact of diabetes. Crit Care Med. 2008;36(8):2249–55. - PubMed
-
- Umpierrez GE, et al. Hyperglycemia: an independent marker of in-hospital mortality in patients with undiagnosed diabetes. J Clin Endocrinol Metab. 2002;87(3):978–82. - PubMed
Publication types
MeSH terms
Substances
Grants and funding
LinkOut - more resources
Full Text Sources
Medical

