. 2011 Jun 24;286(25):22090-100.
doi: 10.1074/jbc.M111.237966. Epub 2011 May 4.

Protein-disulfide isomerase displaces the cholera toxin A1 subunit from the holotoxin without unfolding the A1 subunit

Affiliations

Protein-disulfide isomerase displaces the cholera toxin A1 subunit from the holotoxin without unfolding the A1 subunit

Michael Taylor et al. J Biol Chem. .

Abstract

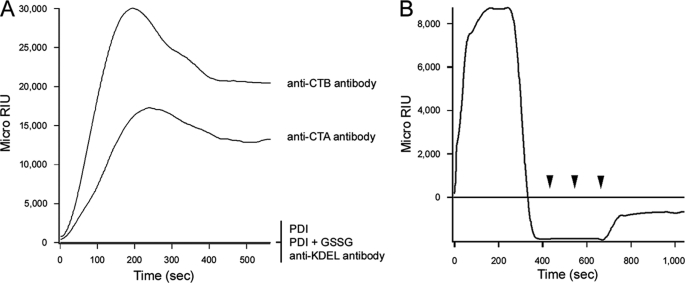
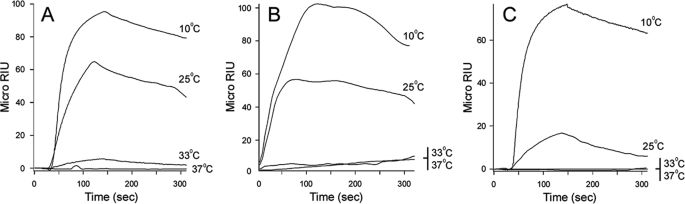
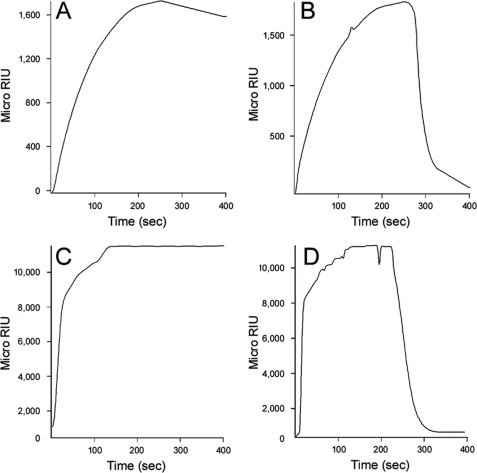
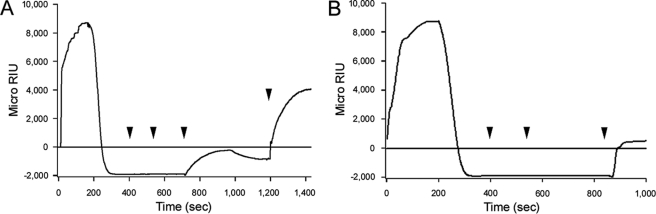
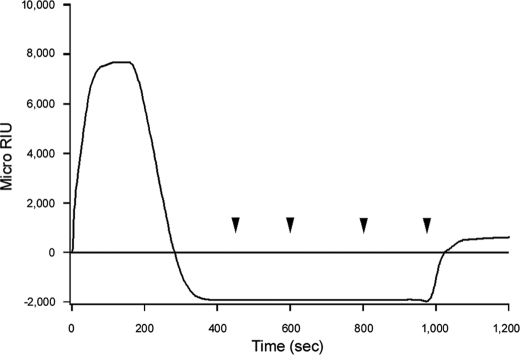
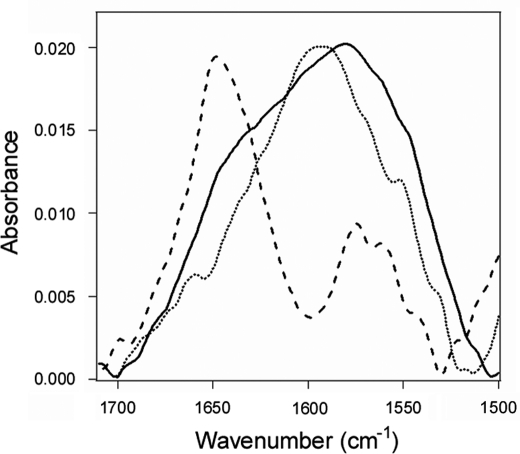
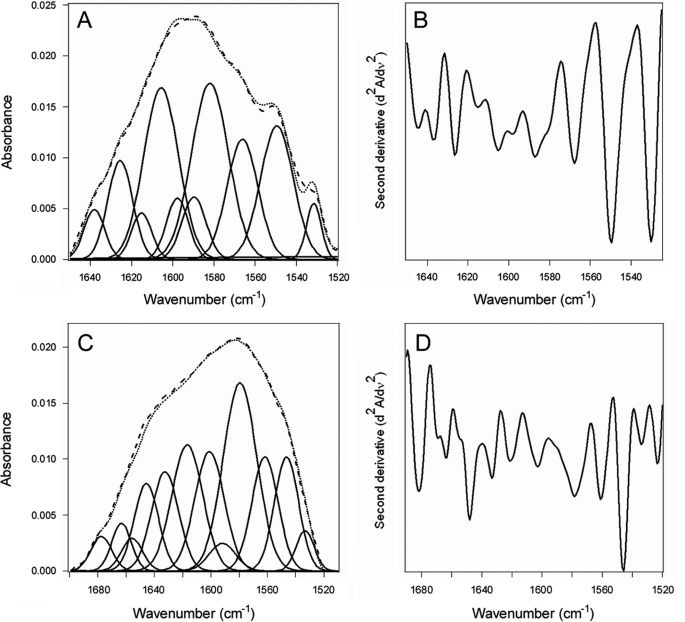
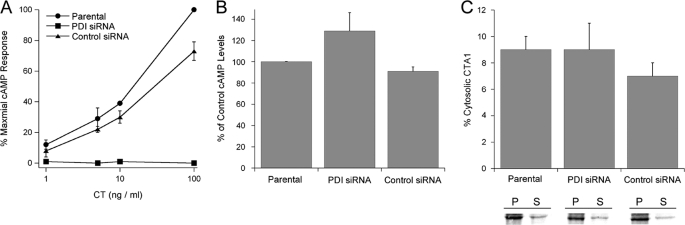
Protein-disulfide isomerase (PDI) has been proposed to exhibit an "unfoldase" activity against the catalytic A1 subunit of cholera toxin (CT). Unfolding of the CTA1 subunit is thought to displace it from the CT holotoxin and to prepare it for translocation to the cytosol. To date, the unfoldase activity of PDI has not been demonstrated for any substrate other than CTA1. An alternative explanation for the putative unfoldase activity of PDI has been suggested by recent structural studies demonstrating that CTA1 will unfold spontaneously upon its separation from the holotoxin at physiological temperature. Thus, PDI may simply dislodge CTA1 from the CT holotoxin without unfolding the CTA1 subunit. To evaluate the role of PDI in CT disassembly and CTA1 unfolding, we utilized a real-time assay to monitor the PDI-mediated separation of CTA1 from the CT holotoxin and directly examined the impact of PDI binding on CTA1 structure by isotope-edited Fourier transform infrared spectroscopy. Our collective data demonstrate that PDI is required for disassembly of the CT holotoxin but does not unfold the CTA1 subunit, thus uncovering a new mechanism for CTA1 dissociation from its holotoxin.


Figures

FIGURE 1.
FIGURE 1.
Dissociation of the CT holotoxin by reduced PDI. A, following ligands were perfused over a CT-coated SPR sensor slide at 37 °C: PDI, oxidized PDI (PDI + 1 mm GSSG), an anti-CTA antibody, an anti-CTB antibody, and an anti-KDEL antibody. B, after taking a baseline measurement corresponding to the mass of the sensor-bound holotoxin, reduced PDI (PDI + 1 mm GSH) was perfused over the CT-coated sensor slide at 37 °C. PDI was removed 400 s into the experiment and replaced with sequential additions of anti-PDI, anti-CTA, and anti-KDEL antibodies as indicated by the arrowheads.
FIGURE 2.
FIGURE 2.
Conformation-dependent interactions between PDI and CTA1. Reduced PDI (PDI + 1 mm GSH) was perfused at the indicated temperatures over SPR sensor slides coated with (A) CTA1, (B) CTA11–168, or (C) CTA11–133. PDI was removed from the perfusion buffer 150 s into the experiment.
FIGURE 3.
FIGURE 3.
CTA1 unfolding displaces toxin-bound PDI. A and B, reduced PDI (PDI + 1 mm GSH) was perfused over a CTA1-coated sensor slide at 37 °C in pH 6.5 buffer. After 250 s, the pH of the perfusion buffer was either (A) maintained at pH 6.5 or (B) shifted to pH 7.0. PDI was present in the perfusion buffer throughout the experiment. C and D, reduced PDI (PDI + 1 mm GSH) was perfused over a CTA1-coated sensor slide at 37 °C in buffer containing 10% glycerol. After 250 s, glycerol was either (C) maintained or (D) removed from the perfusion buffer. PDI was present in the perfusion buffer throughout the experiment.
FIGURE 4.
FIGURE 4.
CT disassembly under conditions that prevent the unfolding of CTA1. After appending CT to a GM1-coated sensor slide, a baseline measurement corresponding to the mass of the bound holotoxin was recorded. Reduced PDI (PDI + 1 mm GSH) was then perfused over the CT-coated sensor at either (A) 37 °C in pH 6.5 buffer or (B) 10 °C in pH 7.0 buffer. PDI was removed 400 s into the experiment and replaced with sequential additions of anti-PDI, anti-CTA, and anti-KDEL antibodies as indicated by the arrowheads. In panel A, an anti-CTB antibody was also perfused over the slide as indicated by the final arrowhead.
FIGURE 5.
FIGURE 5.
Association of PDI with CTA1 after holotoxin disassembly. CT was appended to a SPR sensor slide coated with a polyclonal anti-CTA antibody, and a baseline measurement corresponding to the mass of the bound holotoxin was recorded. Reduced PDI (PDI + 1 mm GSH) was then perfused over the CT-coated sensor at 37 °C. PDI was removed from the perfusion buffer 400 s into the experiment and replaced with sequential additions of an anti-PDI antibody, an anti-CTB antibody, an anti-KDEL antibody, and an anti-CTA monoclonal antibody as indicated by the arrowheads. An identical result was obtained when CT was initially appended to a sensor slide coated with the monoclonal anti-CTA antibody and later detected with the anti-CTA polyclonal antibody.
FIGURE 6.
FIGURE 6.
Effect of PDI binding on CTA1 structure. FTIR spectra were recorded for PDI (dashed line), 13C-labeled CTA1 (dotted line), or a 1:1 molar ratio of PDI + 13C-labeled CTA1 (solid line). All measurements were taken at 10 °C with 1 mm GSH in the pH 7.0 buffer.
FIGURE 7.
FIGURE 7.
Structure of CTA1 in the absence or presence of PDI as evaluated by FTIR at 10 °C. Curve-fitting (A and C) and second derivatives (B and D) for the FTIR spectrum of 13C-labeled CTA1 recorded in the absence (A and B) or presence (C and D) of PDI are shown. In panels A and C, the dotted line represents the sum of all deconvoluted components (solid lines) from the measured spectrum (dashed line). Note that different wavenumber scales are used in panels A and B than in panels and C and D.
FIGURE 8.
FIGURE 8.
In vivo role of PDI in CT intoxication and CTA1 translocation. A, parental TZM cells, TZM 1-2 cells stably transfected with PDI siRNA, and TZM 5-1 cells stably transfected with a nonspecific control siRNA were exposed to the stated concentrations of CT for 2 h. Toxicity was then assessed from the rise in intracellular cAMP. The averages ± standard deviations of three independent experiments with triplicate samples are shown. B, TZM, TZM 1-2, and TZM 5-1 cells were transfected with a plasmid encoding a CTA1 subunit appended with an ER-targeting sequence. cAMP levels recorded at 3 h post-transfection were standardized to CTA1 expression levels, and the resulting data were plotted as percentages of the control response from parental TZM cells. The averages ± ranges of two independent experiments are shown. C, TZM, TZM 1-2, and TZM 5-1 cells were transfected with a plasmid encoding a CTA1 subunit appended with an ER-targeting sequence. CTA1 immunoprecipitated from the membrane (P, pellet) and cytosolic (S, supernatant) fractions of metabolically labeled cells were resolved by SDS-PAGE. The averages ± ranges of cytosolic CTA1 calculated from two independent experiments are shown in the graph.

Similar articles

Cited by

References

    1. De Haan L., Hirst T. R. (2004) Mol. Membr. Biol. 21, 77–92 - PubMed
    1. Sánchez J., Holmgren J. (2008) Cell Mol. Life Sci. 65, 1347–1360 - PMC - PubMed
    1. Zhang R. G., Scott D. L., Westbrook M. L., Nance S., Spangler B. D., Shipley G. G., Westbrook E. M. (1995) J. Mol. Biol. 251, 563–573 - PubMed
    1. Wernick N. L., Chinnapen D. J., Cho J. A., Lencer W. I. (2010) Toxins 2, 310–325 - PMC - PubMed
    1. Lencer W. I., Constable C., Moe S., Jobling M. G., Webb H. M., Ruston S., Madara J. L., Hirst T. R., Holmes R. K. (1995) J. Cell Biol. 131, 951–962 - PMC - PubMed

Publication types

LinkOut - more resources