. 2011 Jun 24;286(25):22101-12.
doi: 10.1074/jbc.M110.196733. Epub 2011 May 4.

Regulation of Src family kinases involved in T cell receptor signaling by protein-tyrosine phosphatase CD148

Affiliations

Regulation of Src family kinases involved in T cell receptor signaling by protein-tyrosine phosphatase CD148

Ondrej Stepanek et al. J Biol Chem. .

Abstract

CD148 is a receptor-like protein-tyrosine phosphatase known to inhibit transduction of mitogenic signals in non-hematopoietic cells. Similarly, in the hematopoietic lineage, CD148 inhibited signal transduction downstream of T cell receptor. However, it also augmented immunoreceptor signaling in B cells and macrophages via dephosphorylating C-terminal tyrosine of Src family kinases (SFK). Accordingly, endogenous CD148 compensated for the loss of the main SFK activator CD45 in murine B cells and macrophages but not in T cells. Hypothetical explanations for the difference between T cells and other leukocyte lineages include the inability of CD148 to dephosphorylate a specific set of SFKs involved in T cell activation or the lack of CD148 expression during critical stages of T cell development. Here we describe striking differences in CD148 expression between human and murine thymocyte subsets, the only unifying feature being the absence of CD148 during the positive selection when the major developmental block occurs under CD45 deficiency. Moreover, we demonstrate that similar to CD45, CD148 has both activating and inhibitory effects on the SFKs involved in TCR signaling. However, in the absence of CD45, activating effects prevail, resulting in functional complementation of CD45 deficiency in human T cell lines. Importantly, this is independent of the tyrosines in the CD148 C-terminal tail, contradicting the recently proposed phosphotyrosine displacement model as a mechanism of SFK activation by CD148. Collectively, our data suggest that differential effects of CD148 in T cells and other leukocyte subsets cannot be explained by the CD148 inability to activate T cell SFKs but rather by its dual inhibitory/activatory function and specific expression pattern.


Figures

FIGURE 1.
FIGURE 1.
CD148 expression on peripheral αβT cells differs between mice and humans. Murine or human peripheral blood leukocytes were stained with anti-CD19, anti-αβTCR, and anti-CD148 antibodies. A, shown are CD148 levels on blood αβT cells (CD19αβTCR+, dashed line) and B cells (CD19+αβTCR, solid line). αβT cells stained with secondary antibody only are provided as a negative control (gray-filled histogram). B, shown is CD148 signal intensity (mean fluorescence intensity) on αβT cells shown as a percentage of CD148 signal intensity on B cells in murine or human blood. Data are the mean ± S.D. of five (mouse) or four (human) donors.
FIGURE 2.
FIGURE 2.
CD148 expression is down-regulated in mice but up-regulated in humans during thymic αβT cell development. A, murine thymocytes from 2–16-week-old mice were stained with antibodies to CD4, CD8, CD11c, CD19, CD148, αβTCR, γδTCR, and NK1.1. Cells of non-T cell lineage were gated out, and the remaining cells were divided into five developmental stages: DN, iSP, DP, SP8, and SP4 (see supplemental Fig. 1 for details). CD148 fluorescence intensity (solid black line) as well as background signal (gray) of particular thymocyte subpopulations from a representative thymus (of five) is shown. B, human thymocytes were stained with antibodies to CD3, CD4, CD8, CD34, CD45, and CD148. Thymocytes were divided into five developmental stages similarly as for mouse thymus: DN, iSP, DP, SP8, and SP4 (supplemental Fig. 2). CD148 fluorescence intensity as well as the background signal of particular thymocyte subpopulations from a representative thymus (of six) is shown. C, quantification of CD148 expression in murine T cell subsets is shown as mean fluorescence intensity because CD148 was homogenously expressed in all individual subpopulations. Data are the mean ± S.D., n = 3. D, some human subsets (DP and SP) exhibited a bimodal distribution of CD148 signal; therefore, the percentage of CD148-positive cells at a particular developmental stage is shown. Data are the mean ± S.D., n = 3. E, murine thymocytes from 4–6-week-old mice were stained with antibodies to CD4, CD8, CD11a, CD11b, CD19, CD45, αβTCR, γδTCR, and NK1.1 and FACS-sorted. RNA was isolated and subjected to RT-quantitative PCR with primers specific for CD148, actinβ, tubulinβ2A, TATA-box binding protein, HPRT1, or eEF-1α1. The relative amount of CD148 mRNA was determined after normalization using the geometric mean of mRNA levels of all used reference genes. The CD148 mRNA level in DN subpopulation was arbitrarily set as 1. Data are the mean ± S.D., n = 4.
FIGURE 3.
FIGURE 3.
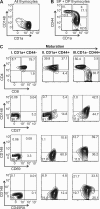
CD148 is expressed exclusively on mature thymocytes in humans. Human thymocytes were investigated by polychromatic flow cytometry after staining with antibodies to CD1a, CD3, CD4, CD8, CD44, CD45, CD148, and CD27 or CD45RA or CD69. A representative thymus (of three) is shown. A, staining of the entire thymocyte pool with CD148 and CD1a shows inverse correlation between the expressions of these two surface proteins. B, CD1a versus CD44 staining of SP+DP thymocyte pool (CD4+ and/or CD8+) shows three subsets representing three maturation stages from CD1a+CD44 (here termed I) through CD1a+CD44+ (II) to CD1aCD44+ (III). C, shown is expression of CD4 versus CD8 and CD148 versus CD27, CD69, or CD45RA of particular maturation stages gated as shown in B.
FIGURE 4.
FIGURE 4.
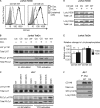
CD148 binds Lck and Fyn and dephosphorylates their C-terminal tyrosines. JS-7 cells transduced with CD148-WT or CD148-CS inactive mutant and non-transduced cells (NT) were used to study the ability of CD148 to bind and activate SFKs in T cells. A, Myc-tagged CD148-WT or CS mutant were immunoprecipitated from transduced JS-7 cell lysates with anti-Myc antibodies. Lysates and immunoprecipitates (IP) were analyzed by immunoblotting using anti-Lck, anti-Fyn, and anti-CD148 antibody. Non-transduced JS-7 cells were used as a negative control. A representative experiment (of five) is shown. B, cells were lysed, and levels of the phosphorylated form of Lck (Tyr(P)-505 (pLck)), total Lck, the phosphorylated forms of Fyn+Src (Tyr(P)-528 at Fyn, Tyr(P)-530 at Src (pFyn/Src)), the non-phosphorylated forms of Fyn+Src (Tyr-528 at Fyn, Tyr-530 at Src (non-pFyn/Src)), and total Fyn were detected via immunoblotting with specific antibodies. C and D, quantification of phosphorylated Lck and phosphorylated and non-phosphorylated levels of Fyn+Src normalized for total Lck and Fyn level, respectively, are shown. The quantification of immunoblots was performed using Odyssey infrared imaging system. Data represent the mean ± S.D. of triplicates of one representative experiment (of at least three). E, shown are relative levels of phosphorylated Lck, phosphorylated Fyn+Src, and non-phosphorylated Fyn+Src (normalized to total Lck and Fyn expression, respectively) in the CD148-WT and CD148-CS expressing cells compared with non-transduced cells. Data represent the mean from three independent experiments. p values for the significance of the difference between CD148-WT- and CD148-CS-expressing cells are also shown.
FIGURE 5.
FIGURE 5.
CD148 complements CD45 deficiency of JS-7 cells. JS-7 cells transduced with CD148-WT, CD148-CS inactive mutant, or CD45 and non-transduced cells (NT) were analyzed for intracellular signaling responses after TCR triggering (A–E), and the effects of CD148 knockdown on TCR signaling in JS-7 cells were examined (F and G). A, transgenic JS-7 cells and non-transduced cells were stimulated with 4 μg/ml anti-TCR-specific antibody for 30 s and immunoblotted after lysis. Anti-phosphotyrosine (pY) antibody was used to detect overall tyrosine phosphorylation in activated and non-activated cells. Re-probing the membrane with anti-Lck rabbit antibody served as a loading control. The phosphorylated bands in the non-stimulated samples probably represent Src family kinases that migrate in the corresponding molecular weight range. B, transgenic JS-7 cells and non-transduced cells were stimulated with 4 μg/ml anti-TCR-specific antibody for 30 s or left non-stimulated and immunoblotted after lysis. The blots were stained with the antibody to the activation loop tyrosine of SFKs (Tyr(P)-416 (pY416), numbered according to chicken Src). Re-probing the membrane with antibody to total-Lck served as a loading control. C, transgenic JS-7 cells and non-transduced cells were stimulated with 4 μg/ml anti-TCR specific antibody for 1 min and immunoblotted after lysis. Anti-phospho-Erk1/2 (Thr(P)-202/Tyr(P)-204 (pErk)) antibody was used to detect Erk activation in stimulated and non-stimulated cells. Re-probing the membrane with anti-Erk2 antibody was used as a loading control. D, JS-7 cells ectopically expressing CD148-WT (solid black line), CD148-CS mutant (dashed black line), or CD45 (dashed gray line) and non-transduced JS-7 cells (solid gray line) were analyzed by flow cytometry after Fluo4 loading. Anti-TCR antibody (200 ng/ml) was added 30 s after beginning the measurement. One representative experiment (of four) is shown. E, transduced JS-7 cells and non-transduced cells were activated via immobilized anti-TCR antibody overnight and examined for CD69 expression. Black bars represent the CD69 signal of non-stimulated cells (including autofluorescence), and white bars represent CD69 up-regulation after TCR stimulation. Data are the mean ± S.D. Data originate from triplicates from one representative experiment (of five). F, shown are the effects of CD148 silencing by electroporation of specific interfering RNA oligonucleotides on CD148 surface level in JS-7 cells. G, CD148 silenced and control JS-7 cells were examined for up-regulation of CD69 after plate-bound anti-TCR antibody stimulation via flow cytometry. *, p < 0.005. Data are the mean ± S.D. Data originate from triplicates from one representative experiment (of four).
FIGURE 6.
FIGURE 6.
CD148 complements CD45 deficiency in two additional T cell lines. J45.01 cells (A) and CD45-HPB-ALL (B) were transduced with N-terminal Myc-tagged CD148-WT. Expression of CD148 was verified by extracellular anti-Myc staining followed by flow cytometry analysis. Calcium influx was measured by flow cytometry after Fluo4 loading. Anti-TCR antibody (2 μg/ml, for J45.01) or anti-CD3 antibody (40 μg/ml, for CD45HPB-ALL) was added 30 s after beginning the measurement. One representative experiment (of three) is shown.
FIGURE 7.
FIGURE 7.
Effects of CD148 on phosphorylation of its potential substrates in TCR signal transduction pathway. A, expression of CD148- WT or C1239S mutant was induced with doxycycline (Dox) and analyzed by flow cytometry. B, expression of CD148-WT or CD148-CS was induced in Jurkat TetOn cells with doxycycline. Subsequently, the cells were stimulated with 4 μg/ml anti-TCR specific antibody for 30 s or left non-stimulated and immunoblotted after lysis. The phosphorylation status of LAT Tyr-191 and PLCγ1 Tyr-783 was detected with specific antibodies. Re-staining the membranes with antibodies to total LAT or PLCγ1, respectively, served as loading controls. C, non-transduced JS-7 cells (NT) and transgenic JS-7 cells expressing CD148 -WT, CD148-CS, or CD45 were stimulated with 4 μg/ml anti-TCR-specific antibody for 30 s or left non-stimulated and immunoblotted after lysis. The phosphorylation status of LAT Tyr-191 and PLCγ1 Tyr-783 was detected with specific antibodies. Re-probing the membranes with antibodies to total LAT or PLCγ1, respectively, served as loading controls. D, Jurkat cells inducibly expressing CD148-WT or CD148-CS were lysed, and phosphorylation of Lck inhibitory tyrosine 505 and Lck activation loop tyrosine 394 was detected by antibodies to Lck Tyr(P)-505 and Src Tyr(P)-416, respectively. Total Lck was used as a loading control. One representative experiment (of three) is shown. E, relative change in phosphorylation of both key Lck tyrosines normalized to total Lck after the induction of CD148-WT or CS expression was quantified using the Odyssey infrared imaging system. The level of phosphorylation in cells untreated with doxycycline was arbitrarily set as 1 (black line). Data are the mean ± S.D. (n = 4 for WT and 3 for CS). *, p (WT versus CS) < 0.05; **, p (WT versus CS) < 0.01. F, JS-7 cells expressing Myc-CD148-WT or Myc-CD148-DA and non-transduced cells were lysed in phosphate buffer without phosphatase inhibitors and subjected to immunoprecipitation (IP) via anti-Myc-tag antibody. The precipitates were immunoblotted and stained with antibodies to total Lck, Tyr(P)-416 of Src (SFK pY416), and Tyr(P)-505 of Lck.
FIGURE 8.
FIGURE 8.
Catalytic domain of CD148 but not the C-terminal tyrosines is required for SFK recognition as a substrate. JS-7 cells transduced with CD148-WT, CD148–2YF mutant, CD148–3YF mutant, or CD148/SHP1 chimera and non-transduced cells (NT) were analyzed for intracellular signaling response after TCR triggering. A, transgenic JS-7 cells and non-transduced cells were stimulated with 4 μg/ml anti-TCR antibody for 30 s and immunoblotted. Anti-phosphotyrosine antibody was used to detect overall tyrosine phosphorylation in activated and non-activated cells. Re-probing the membrane with anti-Erk2 antibody was used as a loading control. B, transgenic JS-7 cells and non-transduced cells were activated via plate-bound anti-TCR antibody overnight and examined for CD69 expression via flow cytometry. Black bars represent CD69 signals in non-stimulated cells (including autofluorescence), whereas white bars represent CD69 up-regulation after TCR stimulation. Data are the mean ± S.D. Data originate from triplicates from one representative experiment (of four). a.u., arbitrary units; Chim, chimera. C, JS-7 cells ectopically expressing CD148-WT (solid black line), CD148–2YF mutant (dashed gray line), or CD148–3YF mutant (solid gray line), and non-transduced JS-7 cells (dashed black line) were analyzed by flow cytometry after Fluo4 loading. Anti-TCR antibody (200 ng/ml) was added 30 s after beginning of the measurement. One representative experiment (of five) is shown. D, shown is the same experiment as in C with JS-7 cells ectopically expressing CD148-WT (solid black line) or CD148/SHP1 chimera (solid gray line) and non-transduced JS-7 cells (dashed black line). One representative experiment (of five) is shown.

Similar articles

Cited by

References

    1. Hermiston M. L., Zikherman J., Zhu J. W. (2009) Immunol. Rev. 228, 288–311 - PMC - PubMed
    1. Honda H., Inazawa J., Nishida J., Yazaki Y., Hirai H. (1994) Blood 84, 4186–4194 - PubMed
    1. Kuramochi S., Matsuda S., Matsuda Y., Saitoh T., Ohsugi M., Yamamoto T. (1996) FEBS Lett. 378, 7–14 - PubMed
    1. Zhang L., Martelli M. L., Battaglia C., Trapasso F., Tramontano D., Viglietto G., Porcellini A., Santoro M., Fusco A. (1997) Exp. Cell Res. 235, 62–70 - PubMed
    1. Autschbach F., Palou E., Mechtersheimer G., Rohr C., Pirotto F., Gassler N., Otto H. F., Schraven B., Gaya A. (1999) Tissue Antigens 54, 485–498 - PubMed

Publication types

MeSH terms