Quantifying selection and diversity in viruses by entropy methods, with application to the haemagglutinin of H3N2 influenza
- PMID: 21543352
- PMCID: PMC3177615
- DOI: 10.1098/rsif.2011.0105
Quantifying selection and diversity in viruses by entropy methods, with application to the haemagglutinin of H3N2 influenza
Abstract
Many viruses evolve rapidly. For example, haemagglutinin (HA) of the H3N2 influenza A virus evolves to escape antibody binding. This evolution of the H3N2 virus means that people who have previously been exposed to an influenza strain may be infected by a newly emerged virus. In this paper, we use Shannon entropy and relative entropy to measure the diversity and selection pressure by an antibody in each amino acid site of H3 HA between the 1992-1993 season and the 2009-2010 season. Shannon entropy and relative entropy are two independent state variables that we use to characterize H3N2 evolution. The entropy method estimates future H3N2 evolution and migration using currently available H3 HA sequences. First, we show that the rate of evolution increases with the virus diversity in the current season. The Shannon entropy of the sequence in the current season predicts relative entropy between sequences in the current season and those in the next season. Second, a global migration pattern of H3N2 is assembled by comparing the relative entropy flows of sequences sampled in China, Japan, the USA and Europe. We verify this entropy method by describing two aspects of historical H3N2 evolution. First, we identify 54 amino acid sites in HA that have evolved in the past to evade the immune system. Second, the entropy method shows that epitopes A and B on the top of HA evolve most vigorously to escape antibody binding. Our work provides a novel entropy-based method to predict and quantify future H3N2 evolution and to describe the evolutionary history of H3N2.
Figures


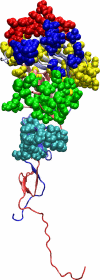
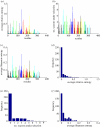
 . The colours represent positions in epitopes A to E and positions outside the epitopes, as in figure 1. (b) Number of seasons for each position when the relative entropy was greater than the threshold Sithres, i.e. the position was under selection. (c) Average diversity in each position quantified by Shannon entropy in the seasons from 1993–1994 to 2009–2010, calculated by
  . (d) Distribution of the average selection in each position displayed in (a). (e) Distribution of the numbers of seasons under selection displayed in (b). (f) Distribution of the average diversity in each position shown in (c).
References
-
- Li Y., Carroll D. S., Gardner S. N., Walsh M. C., Vitalis E. A., Damon I. K. 2007. On the origin of smallpox: correlating variola phylogenics with historical smallpox records. Proc. Natl Acad. Sci. USA 104, 15 787–15 79210.1073/pnas.0609268104 (doi:10.1073/pnas.0609268104) - DOI - DOI - PMC - PubMed
-
- World Health Organization Media Centre influenza fact sheet 211. 2009 See http://www.who.int/mediacentre/factsheets/fs211/en/index.html .
-
- Wiley D. C., Wilson I. A., Skehel J. J. 1981. Structural identification of the antibody-binding sites of Hong Kong influenza haemagglutinin and their involvement in antigenic variation. Nature 289, 373–37810.1038/289373a0 (doi:10.1038/289373a0) - DOI - DOI - PubMed
-
- Nobusawa E., Sato K. 2006. Comparison of the mutation rates of human influenza A and B viruses. J. Virol. 80, 3675–367810.1128/JVI.80.7.3675-3678.2006 (doi:10.1128/JVI.80.7.3675-3678.2006) - DOI - DOI - PMC - PubMed
Publication types
MeSH terms
Substances
Grants and funding
LinkOut - more resources
Full Text Sources
Miscellaneous
