. 2011 Jul;85(14):7256-63.
doi: 10.1128/JVI.02506-10. Epub 2011 May 4.

Role of CD4+ and CD8+ T-cell responses against JC virus in the outcome of patients with progressive multifocal leukoencephalopathy (PML) and PML with immune reconstitution inflammatory syndrome

Affiliations

Role of CD4+ and CD8+ T-cell responses against JC virus in the outcome of patients with progressive multifocal leukoencephalopathy (PML) and PML with immune reconstitution inflammatory syndrome

Sarah Gheuens et al. J Virol. 2011 Jul.

Abstract

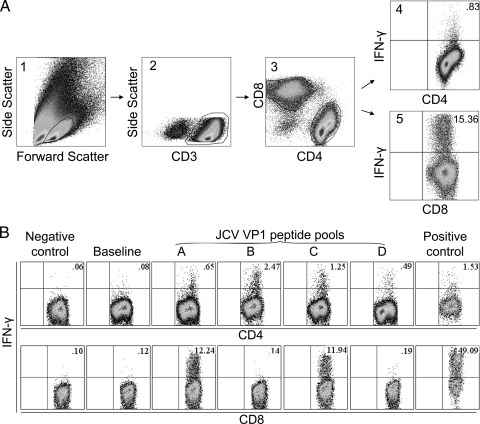
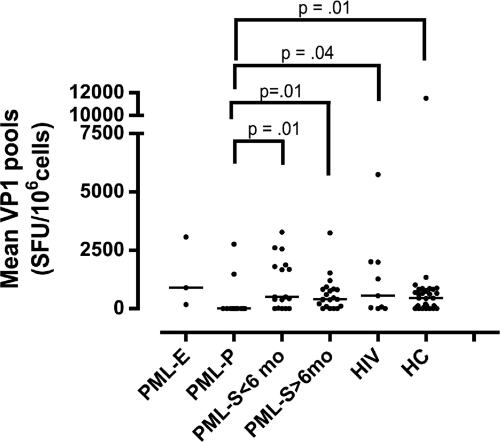
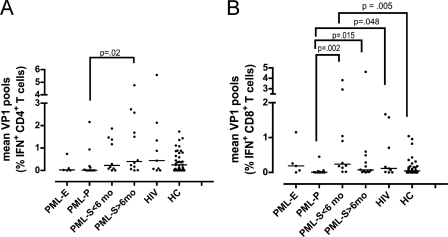
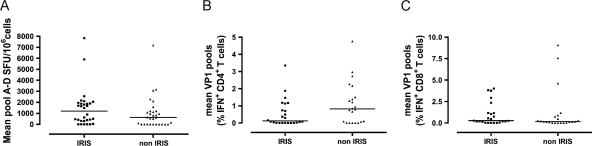
Progressive multifocal leukoencephalopathy (PML) is a severe demyelinating disease of the brain caused by JC virus (JCV). To assess the role of CD4(+) and CD8(+) T-cells against JCV in the clinical outcome of PML and PML in the setting of immune reconstitution inflammatory syndrome (IRIS), we tested gamma interferon (IFN-γ) response by enzyme-linked immunosorbent spot (ELISpot) and intracellular cytokine staining (ICS) in 117 subjects, including 66 PML patients with different clinical outcomes. Both assays were concordant and demonstrated that the cellular immune response against JCV is associated with better clinical outcome. PML survivors had an early CD8(+) T-cell response more frequently than PML progressors (100% versus 27.3%; P = 0.001), while only a trend was observed for the early CD4(+) T-cell response between these two groups (80% versus 45.5%; P = 0.18). Although IRIS itself was more frequent in the PML survivor group, there was no difference in IFN-γ-producing CD4(+) and CD8(+) T-cells between IRIS and non-IRIS PML patients, suggesting that T-cells expressing other cytokines likely have a role in the immunopathogenesis of IRIS. ELISpot and ICS assays are useful prognostic markers of PML evolution and may help in the clinical management of these patients.


Figures

Fig. 1.
Fig. 1.
Gamma interferon (IFN-γ) response in CD4+ and CD8+ T-cells of 3 PML survivors after stimulation with JC virus peptides. (A) Gating strategy on peripheral blood cells of one PML survivor. Lymphocytes stimulated with JCV peptide pool D are selected by forward and side scatter in panel 1. The CD3+ T-cells are delineated in panel 2, and CD4+ and CD8+ T-cells are then gated in panel 3. IFN-γ-expressing CD4+ and CD8+ T-cells are shown in the upper right quadrants of panels 4 and 5, and their percentages are indicated. (B) IFN-γ response in CD4+ and CD8+ T-cells of 2 PML survivors after stimulation with JC virus peptides. The percentages of IFN-γ-expressing CD4+ T-cells of one patient (upper row) and CD8+ T-cells of another patient (lower row) are indicated in each dot plot. PBMC were stimulated with 97 overlapping 15-mer peptides covering the entire JCV VP1 protein, divided into pools A to D, for 10 to 14 days, rested in serum free-media, and then restimulated with the same pools for 6 h during the ICS assay. Negative control consisted of cells stimulated with no peptide at any given time point. Positive control consisted of cells which were stimulated with phytohemagglutinin (PHAM) during the intracellular cytokine staining. Some cells were stimulated with pools A to D at the time of going into culture but not restimulated at the time of ICS. The IFN-γ secretion of these cells measured during the ICS was considered the baseline IFN-γ secretion for that specific pool. In this example, only the baseline IFN-γ secretion for pool B is shown. The CD4+ T-cell response in each pool was at least twice the baseline and considered positive in all pools, while the CD8+ T-cell response was positive for pools A and C.
Fig. 2.
Fig. 2.
Measurement of the cellular immune response against JC virus by enzyme-linked immunosorbent spot (ELISpot) assay. Results are for the first ELISpot assays in 3 early PML patients (PML-E), 12 PML progressors (PML-P), 17 PML survivors (PML-S) within 6 months of PML onset (<6 mo), 21 PML survivors 6 months after PML onset (>6 mo), 9 HIV control subjects (HIV+), and 36 healthy control subjects (HC). Each dot represents the mean response of a patient to pool A through pool D in the first ELISpot assay. SFU, spot-forming units. The bars indicate the median results within the respective groups.
Fig. 3.
Fig. 3.
Measurement of the cellular immune response against JC virus by ICS assay. Shown are CD4+ (A) and CD8+ (B) T-cell responses in the first ICS assay in 5 early PML patients (PML-E), 11 PML progressors (PML-P), 10 PML survivors (PML-S) within 6 months of PML onset (<6 mo), 12 PML survivors 6 months after PML onset (>6 mo), 9 HIV control subjects (HIV+), and 39 healthy control subjects (HC). Each dot represents the mean CD4+ or mean CD8+ T-cell response of a patient to pool A through pool D in the first ICS assay. The mean result is expressed as the percentage of gamma interferon-producing CD4+ T-cells versus the total CD4+ T-cells or the percentage of gamma interferon-producing CD8+ T-cells versus the total CD8+ T-cells. The bars indicate the median results for the respective groups.
Fig. 4.
Fig. 4.
Measurement of the cellular immune response against JC virus by ELISpot and ICS assays in PML and PML-IRIS patients. Thirty ELISpot assays and CD4+ and CD8+ T-cell responses in 24 ICS assays in 18 IRIS patients were matched to non-IRIS patients by HIV status, CD4 count, and time interval since disease onset. Each dot represents the mean ELISpot (A), mean CD4+ T-cell response (B), and mean CD8+ T-cell response (C) of a patient to pool A through pool D. For the ELISpot, the mean result is expressed as SFU per 106 cells. Bars are the median results for the respective groups. For the ICS, the mean result is expressed as the percentage of gamma interferon-producing CD4+ or CD8+ T-cells versus the total CD4+ or CD8+ T-cells. Bars are the median results for the respective groups.

Similar articles

Cited by

References

    1. Bonham S., Meya D. B., Bohjanen P. R., Boulware D. R. 2008. Biomarkers of HIV immune reconstitution inflammatory syndrome. Biomark Med. 2:349–361 - PMC - PubMed
    1. Bourgarit A., et al. 2006. Explosion of tuberculin-specific Th1-responses induces immune restoration syndrome in tuberculosis and HIV co-infected patients. AIDS 20:F1–F7 - PubMed
    1. Brickelmaier M., et al. 2009. Identification and characterization of mefloquine efficacy against JC virus in vitro. Antimicrob. Agents Chemother. 53:1840–1849 - PMC - PubMed
    1. Chen Y., et al. 2009. Asymptomatic reactivation of JC virus in patients treated with natalizumab. N. Engl. J. Med. 361:1067–1074 - PMC - PubMed
    1. Cianchetta-Sivori M., Raso S., Fernandez-Guerrero M., Gorgolas M., Garcia R. 2007. Do CD8(+)CD25(+) cells predict immune reconstitution syndrome in HIV-positive patients who begin HAART? AIDS 21:2347–2349 - PubMed

Publication types

MeSH terms