. 2011 Jul;85(14):7005-19.
doi: 10.1128/JVI.00586-11. Epub 2011 May 4.

Neutralizing monoclonal antibodies against hepatitis C virus E2 protein bind discontinuous epitopes and inhibit infection at a postattachment step

Affiliations

Neutralizing monoclonal antibodies against hepatitis C virus E2 protein bind discontinuous epitopes and inhibit infection at a postattachment step

Michelle C Sabo et al. J Virol. 2011 Jul.

Abstract

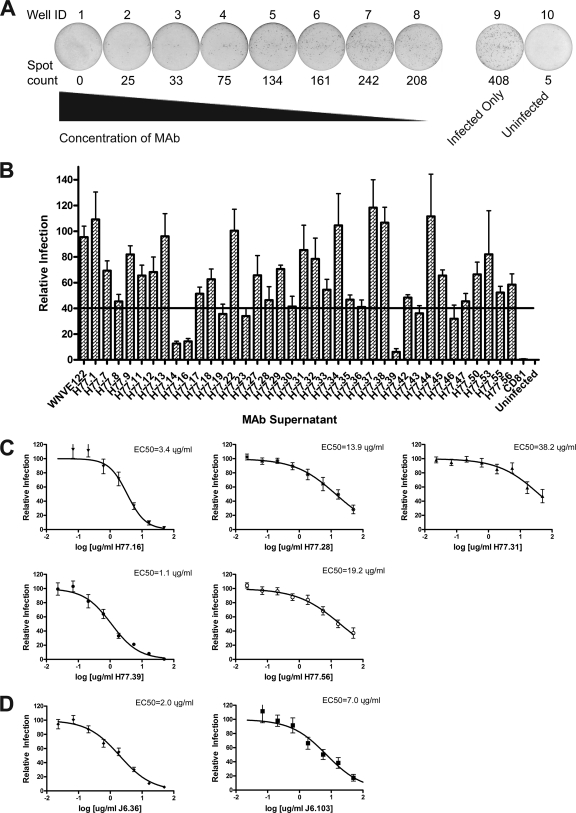
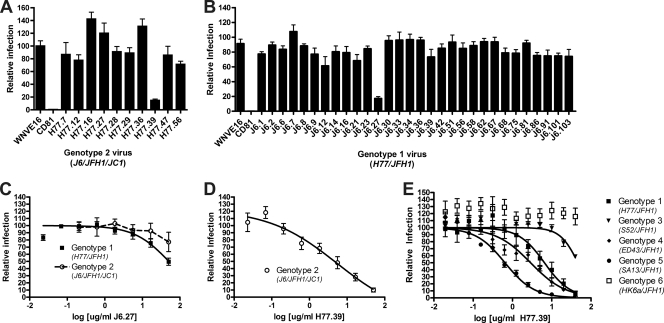
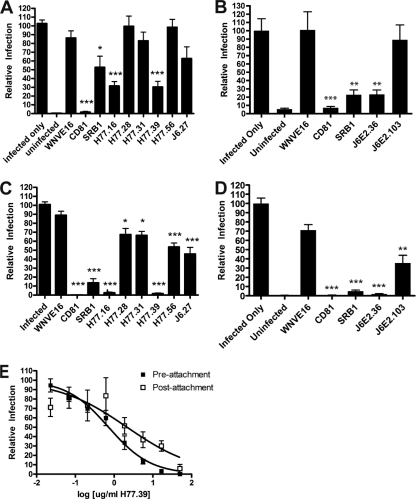
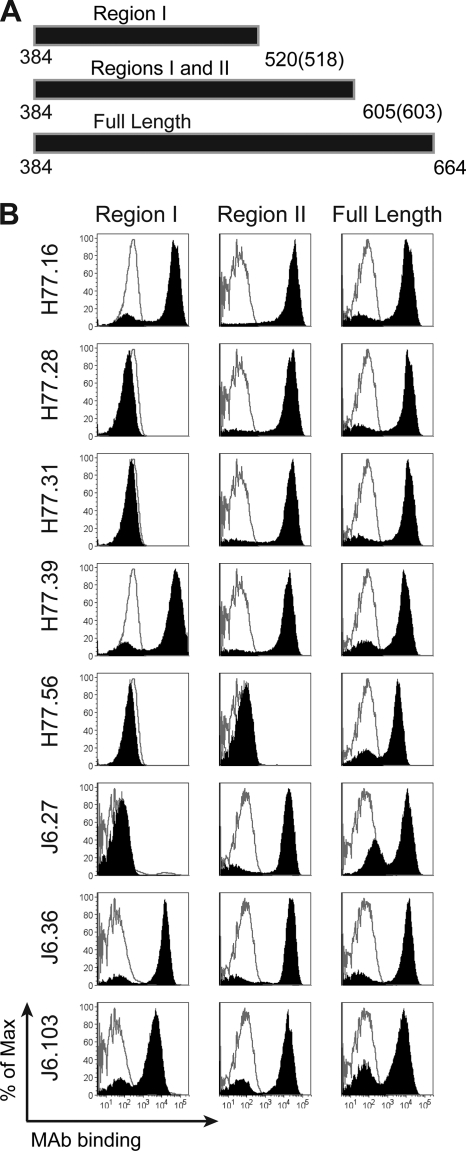
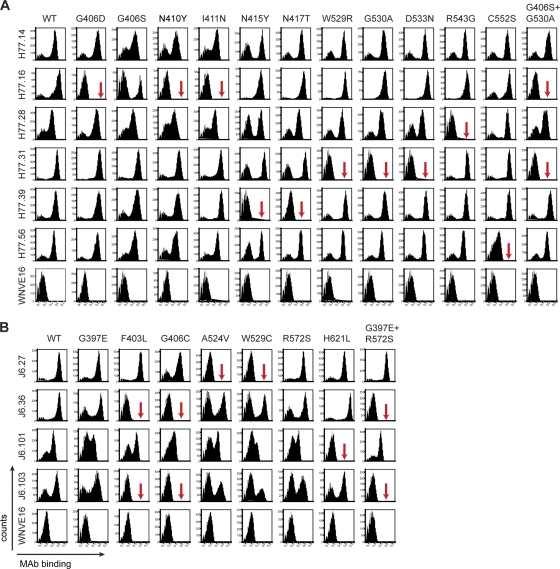
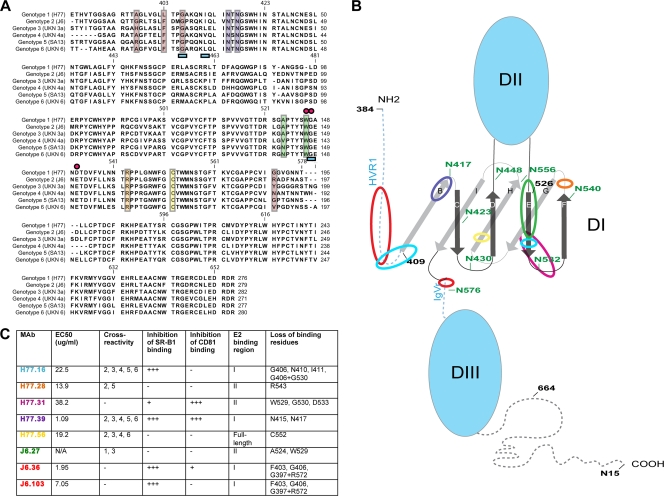
The E2 glycoprotein of hepatitis C virus (HCV) mediates viral attachment and entry into target hepatocytes and elicits neutralizing antibodies in infected patients. To characterize the structural and functional basis of HCV neutralization, we generated a novel panel of 78 monoclonal antibodies (MAbs) against E2 proteins from genotype 1a and 2a HCV strains. Using high-throughput focus-forming reduction or luciferase-based neutralization assays with chimeric infectious HCV containing structural proteins from both genotypes, we defined eight MAbs that significantly inhibited infection of the homologous HCV strain in cell culture. Two of these bound E2 proteins from strains representative of HCV genotypes 1 to 6, and one of these MAbs, H77.39, neutralized infection of strains from five of these genotypes. The three most potent neutralizing MAbs in our panel, H77.16, H77.39, and J6.36, inhibited infection at an early postattachment step. Receptor binding studies demonstrated that H77.39 inhibited binding of soluble E2 protein to both CD81 and SR-B1, J6.36 blocked attachment to SR-B1 and modestly reduced binding to CD81, and H77.16 blocked attachment to SR-B1 only. Using yeast surface display, we localized epitopes for the neutralizing MAbs on the E2 protein. Two of the strongly inhibitory MAbs, H77.16 and J6.36, showed markedly reduced binding when amino acids within hypervariable region 1 (HVR1) and at sites ∼100 to 200 residues away were changed, suggesting binding to a discontinuous epitope. Collectively, these studies help to define the structural and functional complexity of antibodies against HCV E2 protein with neutralizing potential.


Figures

Fig. 1.
Fig. 1.
Identification of neutralizing anti-E2 antibodies against HCV. (A) Examples of MAb neutralization as judged by a reduction in the number of FFU, using the Biospot Macroanalyzer. Spot counts are shown below each well, and well numbers are shown above. Wells 1 through 8 represent decreasing (3-fold) concentrations of the neutralizing MAb H77.39 (starting concentration, 50 μg/ml). Well 9 shows infection in the absence of MAb, and well 10 is an uninfected well. The data are representative of three independent experiments performed in duplicate. (B) MAb supernatant was mixed with the H77-JFH1 chimeric HCV for 1 h at 37°C, and Huh-7.5 cells were infected. Three days later, neutralization was determined by FFU assay. MAb supernatants that decreased the number of FFU to 40% or less (below the solid black line) of the negative-control MAb (anti-WNV E122), as well as additional selected MAbs, were purified for testing in full dose-response analysis. The data are pooled from three independent experiments performed in duplicate. (C) Serial dilutions of genotype 1a-specific purified MAbs were mixed with H77-JFH1 chimeric virus, and neutralization was assessed. Efficient neutralization was observed for five (H77.16, H77.28, H77.31, H77.39, and H77.56) genotype 1a-specific MAbs, but not for the negative-control MAb (data not shown). EC50 values were calculated after nonlinear regression analysis. The data are pooled from at least three independent experiments performed in duplicate. (D) Increasing concentrations of purified genotype 2a-specific MAbs (J6.36 and J6.103) were mixed with J6-JFH1-JC1-luciferase-expressing virus. At 48 h, neutralization was assessed in Huh-7.5 cells by monitoring luciferase expression. EC50 values were calculated after nonlinear regression analysis. The data are pooled from at least three independent experiments performed in duplicate. All error bars represent the standard errors of the mean.
Fig. 2.
Fig. 2.
Identification of MAbs that bind heterologous HCV genotypes using yeast display of E2 protein. The E2 ectodomain gene from six strains corresponding to HCV genotypes 1 to 6 was cloned into the PYD1 vector and expressed on the surface of yeast (see Materials and Methods). Yeasts expressing HCV E2 were incubated with MAb supernatants, and binding was assessed by flow cytometry. Representative histograms from all neutralizing MAbs (H77.16, H77.28, H77.31, H77.39, H77.56, J6.27, J6.36, and J6.103; solid black histograms) and negative-control MAb (WNV E16; unfilled gray histograms) are depicted. The data are representative of at least three independent experiments.
Fig. 3.
Fig. 3.
MAb neutralization of heterologous HCV genotypes. (A and B) MAbs that were generated against genotype 1a (A) or genotype 2a (B) E2 proteins were tested for the ability to neutralize infection by virus from the heterologous genotype. Purified J6 or H77 MAbs (50 μg/ml) were preincubated at 37°C with H77-JFH1 (genotype 1a) or J6-JFH1-JC1 (genotype 2a) virus, respectively, and neutralization was assessed as described in the legend to Fig. 1. (C to E) EC50 analysis was performed with J6.27 MAb and H77-JFH1 virus (▪) or J6-JFH1-JC1 virus (○) (C), H77.39 MAb and J6-JFH1-JC1 virus (○) (D), or H77.39 MAb and H77C/JFH1 (▪), S52/JFH1 (▾), ED43/JFH1 (⧫), SA13/JFH1 (•), and HK6a/JFH1 (□) chimeric viruses (E). The graphs represent pooled data from at least three independent experiments performed in duplicate (A to D) or two independent experiments performed in triplicate (E), and the error bars represent the standard errors of the mean.
Fig. 4.
Fig. 4.
Pre- or postattachment neutralization. (A to D) To determine whether MAbs neutralize HCV infection at a postattachment step, Huh-7.5 cells were prechilled at 4°C, and 480 FFU of genotype 1a (H77-JFH1) (A) or genotype 2a (J6-JFH1-JC1) (B) virus was added to each well for 1 h at 4°C. After three washes with 4°C DMEM, saturating concentrations of MAbs (50 μg/ml) were added for 1 h at 37°C, and the neutralization assay was completed. In comparison, a standard preincubation neutralization test was performed at 37°C, in which genotype 1a virus (C) or genotype 2a virus (D) and MAb were preincubated at 37°C prior to addition to cells. The data shown are the averages of three independent experiments, with the error bars representing standard errors of the mean. Statistically significant differences in neutralization are compared to infection in the presence of a negative-control MAb (WNV E16): *, P < 0.05; **, P < 0.01; and ***, P < 0.001. (E) To confirm the ability of H77.39 to neutralize infection at both pre- and postattachment steps, a dose-response curve was performed under both pre- and postattachment conditions, as described above, using H77/JFH1 virus. The graphs represent pooled data from at least three independent experiments performed in duplicate, and the error bars represent the standard errors of the mean.
Fig. 5.
Fig. 5.
Inhibition of sE2 binding to CD81 and SR-B1 by neutralizing MAbs. (A) Verification of ectopic CD81 and SR-B1 receptor expression on CHO cells. CHO-CD81 or CHO–SR-B1 cells were incubated with either mouse anti-hCD81 or rabbit-anti-hSR-B1 (black histograms) or an irrelevant MAb (unfilled gray histograms) for 30 min on ice. The cells were washed, incubated with the appropriate secondary antibodies, and processed by flow cytometry. (B and C) Binding of genotype 1a (H77) E2 (B) or genotype 2a (J6) E2 (C) to CHO-CD81 and CHO–SR-B1, but not wild-type (WT) CHO cells. CHO-CD81 or CHO–SR-B1 (solid black histograms) or WT CHO (unfilled gray histograms) cells were incubated with sE2, and binding was assayed by flow cytometry. The data are representative of at least three independent experiments. (D) Assessment of inhibition of sE2 binding to CHO-CD81 or CHO–SR-B1 cells by neutralizing MAbs. sE2 was preincubated with neutralizing MAbs and added to CHO cells, and binding was detected by flow cytometry. Examples of MAbs that inhibit sE2 binding to CD81 preferentially (H77.31), to both CD81 and SR-B1 (H77.39), or only to SR-B1 (J6.103), as well as a negative-control MAb (WNV E16), are shown. The histograms are representative of three individual experiments. The solid black histograms represent sE2 binding in the presence of MAb, the red histograms represent sE2 binding in the absence of MAb, and the shaded gray histograms represent sE2 binding to CHO WT cells. (E) Graphical representation of sE2 binding to CHO-CD81 and CHO–SR-B1 cells in the presence of neutralizing MAbs. The values were determined by dividing the fluorescence quotient (mean fluorescence intensity × percent positive cells) for E2 binding in the presence of a neutralizing MAb by the fluorescence quotient of sE2 binding to either CHO-CD81 or CHO–SR-B1 cells alone. The asterisks represent statistically significant differences in sE2 binding compared to the negative-control MAb, WNV E16: *, P < 0.05; **, P < 0.01; and ***, P < 0.001. The error bars represent the standard errors of the mean. The data are pooled from three independent experiments.
Fig. 6.
Fig. 6.
Mapping of anti-E2 antibodies using COOH-terminal truncation mutants. (A) Scheme of E2 truncations used for mapping. cDNA containing region I (aa 384 to 520 and aa 384 to 518 in E2 of genotypes 1a and 2a, respectively) or I and II (aa 384 to 605 and 384 to 603 in E2 of genotypes 1a and 2a, respectively) and the full-length ectodomain (aa 384 to 664) were displayed on the surface of yeast. (B) MAb supernatants were incubated with yeast and assessed for binding by flow cytometry. Neutralizing MAbs binding to regions I (H77.16, H77.39, J6.36, and J6.103) and II (H77.28, H77.31, and J6.27) and the full-length E2 ectodomain (H77.56) are shown. The solid black histograms depict binding of HCV-specific MAbs, and the gray unfilled histograms represent binding of a negative-control MAb (WNV E16). The histograms are representative of three independent experiments.
Fig. 7.
Fig. 7.
Epitope localization of anti-HCV MAbs. Binding of neutralizing MAbs to yeast expressing E2 protein variants. (A) Flow cytometry histograms of wild-type and loss-of-binding genotype 1a E2 variants (G406D, G406S, N410Y, I411N, N415Y, N417T, W529R, G530A, D533N, R543G, C552S, and G406S plus G530A). Representative histograms are shown for the MAbs H77.14, H77.16, H77.28, H77.31, H77.39, H77.56, and WNV E16 (negative control) with WT H77 E2 and each of the variants. The data shown are representative of three independent experiments. The red arrows indicate >80% loss of binding of a specific MAb for a given variant. (B) Flow cytometry histograms of wild-type and loss-of-function genotype 2a E2 variants (G397E, F403L, G406C, A524V, W529C, R572S, H621L, and G397E plus R572S) with individual neutralizing MAbs. Representative histograms are shown for the MAbs J6.27, J6.36, J6.101, J6.103, and WNV E16 (negative control) with the wild-type E2 and each of the variants. The data shown are representative of three independent experiments. The arrows indicate >80% loss of binding of a specific MAb for a given variant.
Fig. 8.
Fig. 8.
Localization of MAb binding residues on E2. (A) Alignment of E2 sequences from HCV genotypes 1 to 6 with superimposed mapping of MAb binding residues. The sequences of E2 from strains representative of the different genotypes (genotype 1a, H77; genotype 2a, J6; genotype 3a, UKN 3; genotype 4a, UKN 4a; genotype 5a, SA513; genotype 6a, UKN 6) used in the yeast-mapping studies (Fig. 2) were aligned. Colored boxes and symbols were used to highlight neutralizing MAb binding residues as follows: red boxes, J6.36 and J6.103; purple boxes, H77.39; blue underscoring, H77.16; green boxes, J6.27; pink circles, H77.31; orange box, H77.28; yellow box, H77.56. (B) Putative model of the structure of the E2 protein with MAb binding regions highlighted. A scheme depicting a possible E2 structure was adapted from Krey et al. (36) to highlight regions involved in MAb recognition. N-linked glycosylation residues are labeled in green, and amino acids are numbered in black at intervals; β-sheets in D1 are labeled as previously described (36). MAb binding regions are highlighted with colored circles as follows: red circles, J6.36 and J6.103; purple circle, H77.39; light-blue circles, H77.16; green circle, J6.27; pink circle, H77.31; orange circle, H77.28; yellow circle, H77.56. (C) Summary of neutralizing MAbs described in this study. EC50 values (neutralization against homologous virus), cross-reactivity to E2 from different genotypes, inhibition of binding to CD81 and SR-B1, reactivity with different regions of E2, and loss-of-binding residues are listed. MAb names are color coded to correspond to panels A and B.

References

    1. Allander T., et al. 2000. Recombinant human monoclonal antibodies against different conformational epitopes of the E2 envelope glycoprotein of hepatitis C virus that inhibit its interaction with CD81. J. Gen. Virol. 81:2451–2459 - PubMed
    1. Balsitis S. J., et al. 2010. Lethal antibody enhancement of dengue disease in mice is prevented by Fc modification. PLoS Pathog. 6:e1000790. - PMC - PubMed
    1. Bankwitz D., et al. 2010. Hepatitis C virus hypervariable region 1 modulates receptor interactions, conceals the CD81 binding site, and protects conserved neutralizing epitopes. J. Virol. 84:5751–5763 - PMC - PubMed
    1. Bartenschlager R., Frese M., Pietschmann T. 2004. Novel insights into hepatitis C virus replication and persistence. Adv. Virus Res. 63:71–180 - PubMed
    1. Bartosch B., et al. 2003. Cell entry of hepatitis C virus requires a set of co-receptors that include the CD81 tetraspanin and the SR-B1 scavenger receptor. J. Biol. Chem. 278:41624–41630 - PubMed

Publication types