. 2011 Jul;21(7):1160-7.
doi: 10.1101/gr.110882.110. Epub 2011 May 4.

Characterization of the single-cell transcriptional landscape by highly multiplex RNA-seq

Affiliations

Characterization of the single-cell transcriptional landscape by highly multiplex RNA-seq

Saiful Islam et al. Genome Res. 2011 Jul.

Abstract

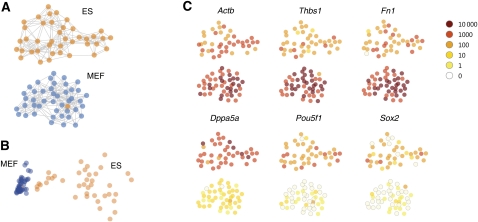
Our understanding of the development and maintenance of tissues has been greatly aided by large-scale gene expression analysis. However, tissues are invariably complex, and expression analysis of a tissue confounds the true expression patterns of its constituent cell types. Here we describe a novel strategy to access such complex samples. Single-cell RNA-seq expression profiles were generated, and clustered to form a two-dimensional cell map onto which expression data were projected. The resulting cell map integrates three levels of organization: the whole population of cells, the functionally distinct subpopulations it contains, and the single cells themselves-all without need for known markers to classify cell types. The feasibility of the strategy was demonstrated by analyzing the transcriptomes of 85 single cells of two distinct types. We believe this strategy will enable the unbiased discovery and analysis of naturally occurring cell types during development, adult physiology, and disease.


Figures

Figure 1.
Figure 1.
Single-cell tagged reverse transcription (STRT). (A) Overview of the method, illustrating the main steps in sample preparation: (i) mRNA (brown) is reverse transcribed using a tailed oligo-dT primer (green), generating a first-strand cDNA with 3-6 added cytosines; (ii) a helper oligo (green) causes template-switching and thereby introduces a barcode (shaded) and a primer sequence into the cDNA; (iii) the product is amplified by single-primer PCR exploiting the template-suppression effect and is then immobilized on beads, fragmented, and A-tailed; (iv) the Illumina P2 adapter (blue) is ligated to the free end; (v) the P1 adapter is introduced in the library PCR step, using a primer tailed with the P1 sequence (blue); and (vi) the final library is sequenced from the P1 side using a custom primer. Each read (arrow) begins by the barcode, followed by three to six Cs, followed by the mRNA insert. (B) Illustration of read mapping and annotation, for a two-exon gene. Reads mapping to the sense strand of exons, as well as to splice junctions, were counted toward the expression of the gene. Reads mapping upstream of, downstream from, or in introns were counted for quality control purposes, and antisense hits were used to judge the background level.
Figure 2.
Figure 2.
Read distribution. (A) Example of reads mapped to both strands of the 5-kb Pou5f1 locus, shown as a coverage plot. The gene structure is shown in blue below the graph. Most reads aligned near the 5′ end of the gene. (B) Density of reads as a function of the position along the transcript, in 5% length bins. The figure shows eight synthetic mRNA (blue bars) and averages for all genes categorized by transcript length as indicated. (C) Read-mapping statistics, showing the fraction of all mapped reads that overlapped each type of annotation (cf. Fig. 1B). The vertical scale shows the percentage of all reads that mapped to exons, introns, splice junctions, 1000 bp upstream of and 1000 bp downstream from transcriptional units, and known repeats. In each case, the black bar shows reads mapped in the sense orientation, and the gray bar shows reads mapped in antisense. Repeats were not directionally annotated and therefore were hit equally on both strands. (D) The same statistics as in C but normalized for the total length of each feature class, expressed as RPKM. This shows more clearly the level of enrichment of exons versus introns, demonstrating good specificity for mRNA and rejection of genomic DNA and/or inspliced intronic RNA.
Figure 3.
Figure 3.
Number of mRNA molecules detected per cell. Approximately 2500 molecules of eight synthetic control mRNAs were spiked into each well. Using the number of reads mapped to synthetic mRNA as a normalizing factor, we converted the raw read counts from each well to an absolute number of mRNA molecules. The figures show the molecule count for each cell ordered by position on the reaction plate. (A) Molecule counts obtained from brain reference total RNA at 10 pg per well. The average observed was 103,000 molecules per well (negative controls: 4300 per well). (B) Molecule counts obtained from cells. A total of 48 ES cells, 44 MEF cells, and four empty wells were included. The overall average was 241,000 per cell (negative controls: 841 per cell). Seven wells apparently failed (molecule numbers similar to the negative controls, shown in pale orange), and were omitted from further analysis. (C) The cumulative fraction of all mRNA as a function of rank order gene expression level. Apparently, a smaller number of genes was expressed, compared with MEFs and RefRNA. (D) The distribution of gene copy number across all genes and cells.
Figure 4.
Figure 4.
Quantitative accuracy. (A) Shows the probability of detection as a function of expression level for ES and MEF cells (shaded areas show 95% intervals). (B) Representative single-cell scatterplot showing the set of genes belonging to the top 1000 in ES and MEF cells (1465 in total). (C) The measured copy number for each of eight synthetic control mRNAs, across the entire plate. Circles show averages, whereas blue dots show individual data points (jittered for clarity). Zero measurements are shown along the horizontal axis, with percentage zeros indicated. For comparison, the dashed line indicates the ideal 45° slope. (D) Comparison of technical variance (based on control RNA) and biological variance (based on the average of genes with expression levels within ±20% of the indicated copy number) across the entire plate. Error bars, 95% confidence intervals; in each case the confidence intervals were nonoverlapping.
Figure 5.
Figure 5.
Graph-based visualization (“cell map”). (A) Cells, represented by graph nodes (circles) were laid out randomly, and edges (gray lines) were drawn from each cell to the five other cells it was most highly correlated with. Then, a force-directed layout was used to lay out the graph on the plane. In this stage, cells repelled each other uniformly but were held together by edges acting as elastic springs. The resulting visual map was consistent with known cell identities (ES cells in orange, MEFs in blue), with a single apparently misplaced cell. Note the lack of edges connecting the clusters, showing that the graph has separated into disjoint components. (B) The same data analyzed by principal component analysis (PCA), again with a single apparently misplaced cell but with less distinct separation by cell type. (C) The expression of selected genes is shown on a logarithmic color scale (inset, upper right). The top row shows genes enriched in MEFs, while the bottom row shows genes enriched in ES cells and known to be ES cell markers

References

    1. Bengtsson M, Stahlberg A, Rorsman P, Kubista M 2005. Gene expression profiling in single cells from the pancreatic islets of Langerhans reveals lognormal distribution of mRNA levels. Genome Res 15: 1388–1392 - PMC - PubMed
    1. Borodulina OR, Kramerov DA 2008. Transcripts synthesized by RNA polymerase III can be polyadenylated in an AAUAAA-dependent manner. RNA 14: 1865–1873 - PMC - PubMed
    1. Chubb JR, Trcek T, Shenoy SM, Singer RH 2006. Transcriptional pulsing of a developmental gene. Curr Biol 16: 1018–1025 - PMC - PubMed
    1. Cloonan N, Forrest AR, Kolle G, Gardiner BB, Faulkner GJ, Brown MK, Taylor DF, Steptoe AL, Wani S, Bethel G et al. 2008. Stem cell transcriptome profiling via massive-scale mRNA sequencing. Nat Methods 5: 613–619 - PubMed
    1. Eisenberg E, Levanon EY 2003. Human housekeeping genes are compact. Trends Genet 19: 362–365 - PubMed

Publication types

Associated data