Induction of B cell responses upon experimental infection of neonatal calves with Mycobacterium avium subsp. paratuberculosis
- PMID: 21543587
- PMCID: PMC3147331
- DOI: 10.1128/CVI.00058-11
Induction of B cell responses upon experimental infection of neonatal calves with Mycobacterium avium subsp. paratuberculosis
Abstract
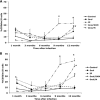
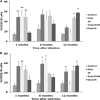
The objective of this study was to determine if experimental infection of neonatal calves with Mycobacterium avium subsp. paratuberculosis would invoke changes in the percentages of total B cells in the peripheral blood mononuclear cell population and of subpopulations of B cells as determined by CD5, CD25, and CD45RO markers during a 12-month period. Experimental infection groups included control (noninfected), oral (infected with M. avium subsp. paratuberculosis strain K-10), oral/DXM (pretreatment with dexamethasone before oral inoculation), i.p. (intraperitoneal inoculation), and oral/M (oral inoculation with mucosal scrapings from a cow with clinical disease) groups. Over the course of the study, the percentages of total B cells in nonstimulated and antigen-stimulated cell cultures increased for oral and i.p. group calves, with the highest percentages noted at 3 and 6 months. Oral/M group calves had increased percentages of activated B cells, as determined by CD5(dim) and CD5(bright) markers, at 9 and 12 months. Experimental infection by all methods resulted in increased expression of CD25(+) and CD45RO(+) B cells early in the study, but the most significant results were observed at 12 months for oral/DXM and oral/M group calves. Immunoblot analyses with a whole-cell sonicate of M. avium subsp. paratuberculosis demonstrated the most reactivity with sera from i.p. group calves and the least reactivity with sera from oral group calves. Further evidence of M. avium subsp. paratuberculosis-specific antibody responses in the i.p. group calves was demonstrated using the ethanol vortex enzyme-linked immunosorbent assay (EvELISA) method. In summary, an induction of B cell responses was noted after experimental infection with M. avium subsp. paratuberculosis, with differences in responses noted according to the method of experimental inoculation.
Figures


Similar articles
-
Disparate host immunity to Mycobacterium avium subsp. paratuberculosis antigens in calves inoculated with M. avium subsp. paratuberculosis, M. avium subsp. avium, M. kansasii, and M. bovis.Clin Vaccine Immunol. 2013 Jun;20(6):848-57. doi: 10.1128/CVI.00051-13. Epub 2013 Apr 3. Clin Vaccine Immunol. 2013. PMID: 23554467 Free PMC article.
-
Early immune markers associated with Mycobacterium avium subsp. paratuberculosis infection in a neonatal calf model.Clin Vaccine Immunol. 2011 Mar;18(3):393-405. doi: 10.1128/CVI.00359-10. Epub 2011 Jan 12. Clin Vaccine Immunol. 2011. PMID: 21228140 Free PMC article.
-
Immune responses after oral inoculation of weanling bison or beef calves with a bison or cattle isolate of Mycobacterium avium subsp. paratuberculosis.J Wildl Dis. 2003 Jul;39(3):545-55. doi: 10.7589/0090-3558-39.3.545. J Wildl Dis. 2003. PMID: 14567215
-
Differential expression of CD5 on B lymphocytes in cattle infected with Mycobacterium avium subsp. paratuberculosis.Vet Immunol Immunopathol. 2008 Dec 15;126(3-4):211-9. doi: 10.1016/j.vetimm.2008.07.004. Epub 2008 Jul 17. Vet Immunol Immunopathol. 2008. PMID: 18692906
-
Early induction of humoral and cellular immune responses during experimental Mycobacterium avium subsp. paratuberculosis infection of calves.Infect Immun. 2003 Sep;71(9):5130-8. doi: 10.1128/IAI.71.9.5130-5138.2003. Infect Immun. 2003. PMID: 12933856 Free PMC article.
Cited by
-
Transcriptional Profiling of Ileocecal Valve of Holstein Dairy Cows Infected with Mycobacterium avium subsp. Paratuberculosis.PLoS One. 2016 Apr 19;11(4):e0153932. doi: 10.1371/journal.pone.0153932. eCollection 2016. PLoS One. 2016. PMID: 27093613 Free PMC article.
-
The within host dynamics of Mycobacterium avium ssp. paratuberculosis infection in cattle: where time and place matter.Vet Res. 2015 Jun 19;46(1):61. doi: 10.1186/s13567-015-0185-0. Vet Res. 2015. PMID: 26092382 Free PMC article. Review.
-
Clinical disease upregulates expression of CD40 and CD40 ligand on peripheral blood mononuclear cells from cattle naturally infected with Mycobacterium avium subsp. paratuberculosis.Clin Vaccine Immunol. 2013 Aug;20(8):1274-82. doi: 10.1128/CVI.00246-13. Epub 2013 Jun 12. Clin Vaccine Immunol. 2013. PMID: 23761659 Free PMC article.
-
Disparate host immunity to Mycobacterium avium subsp. paratuberculosis antigens in calves inoculated with M. avium subsp. paratuberculosis, M. avium subsp. avium, M. kansasii, and M. bovis.Clin Vaccine Immunol. 2013 Jun;20(6):848-57. doi: 10.1128/CVI.00051-13. Epub 2013 Apr 3. Clin Vaccine Immunol. 2013. PMID: 23554467 Free PMC article.
-
B cell phenotypes and maturation states in cows naturally infected with Mycobacterium avium subsp. Paratuberculosis.PLoS One. 2022 Dec 7;17(12):e0278313. doi: 10.1371/journal.pone.0278313. eCollection 2022. PLoS One. 2022. PMID: 36477266 Free PMC article.
References
-
- Amu S., Tarkowski A., Dörner T., Bokarewa M., Brisslert M. 2006. The human immunomodulatory CD25+ B cell population belongs to the memory B cell pool. Scand. J. Immunol. 66:77–86 - PubMed
-
- Amu S., Stromberg K., Bokarewa M., Tarkowski A., Brisslert M. 2007. CD25-expressing B-lymphocytes in rheumatics diseases. Scand. J. Immunol. 64:182–191 - PubMed
-
- Bannantine J. P., Stabel J. R. 2000. HspX is present within Mycobacterium paratuberculosis-infected macrophages and is recognized by sera from some infected cattle. Vet. Microbiol. 76:343–358 - PubMed
-
- Bondada S., Bikah G., Robertson D. A., Sen G. 2000. Role of CD5 in growth regulation of B-1 cells. Curr. Top. Microbiol. Immunol. 252:141–149 - PubMed
-
- Bosio C. M., Gardner D., Elkins K. L. 2000. Infection of B cell-deficient mice with CDC 1551, a clinical isolate of Mycobacterium tuberculosis: delay in dissemination and development of lung pathology. J. Immunol. 164:6417–6425 - PubMed
Publication types
MeSH terms
Substances
LinkOut - more resources
Full Text Sources
Research Materials

