. 2011 May 4;31(18):6809-6819.
doi: 10.1523/JNEUROSCI.6474-10.2011.

Dorsally and ventrally derived oligodendrocytes have similar electrical properties but myelinate preferred tracts

Affiliations

Dorsally and ventrally derived oligodendrocytes have similar electrical properties but myelinate preferred tracts

Richa B Tripathi et al. J Neurosci. .

Abstract

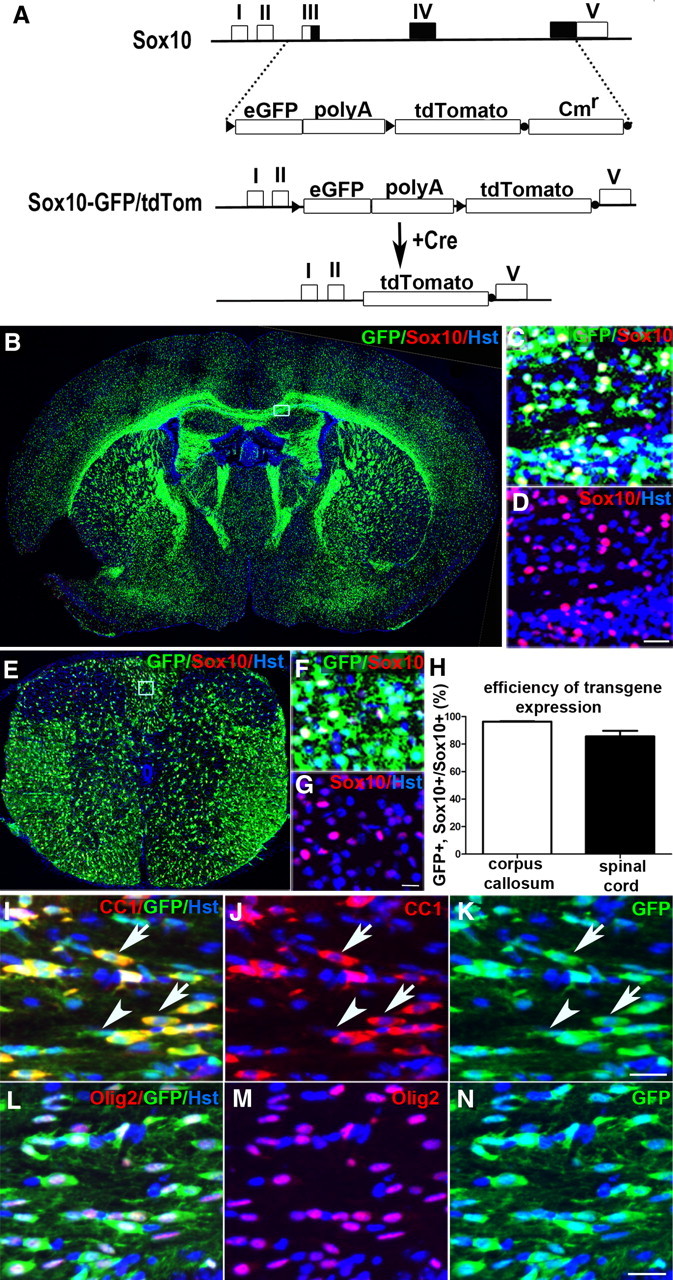
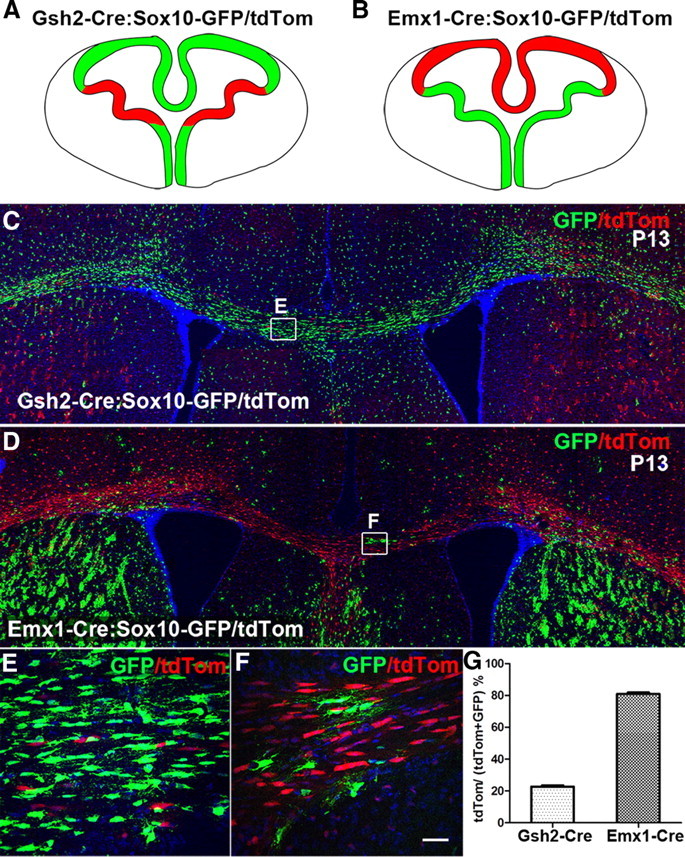
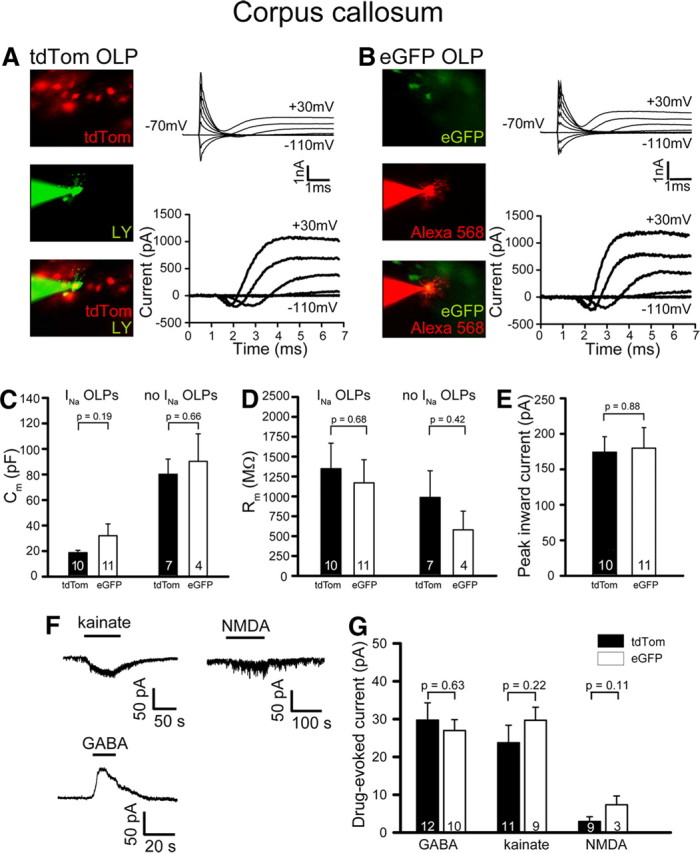
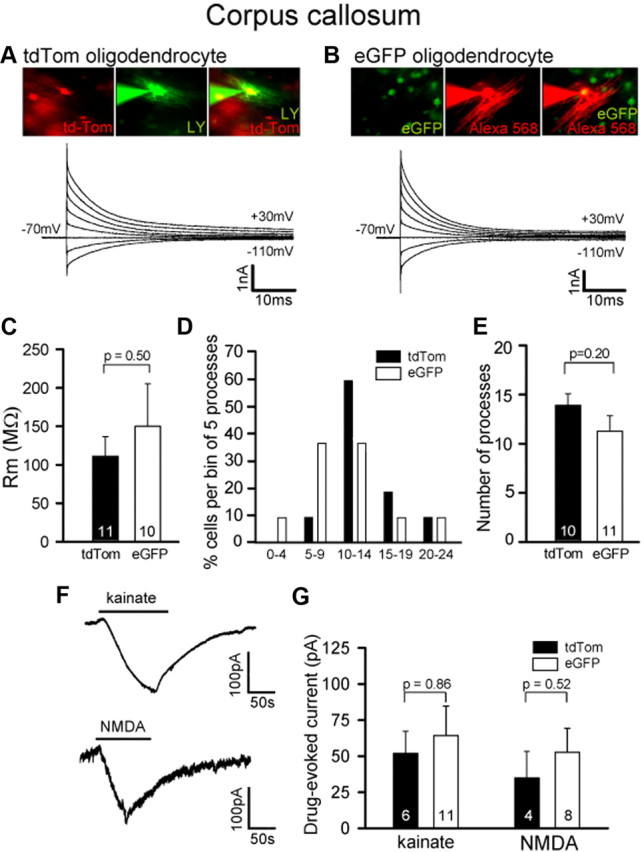
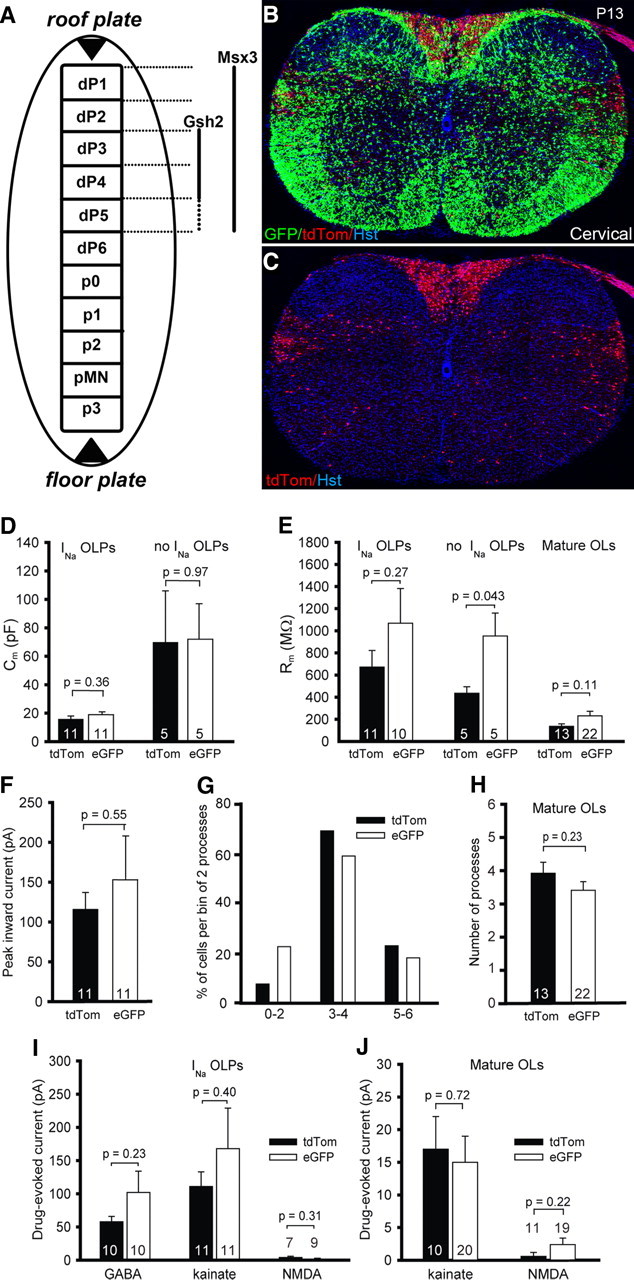
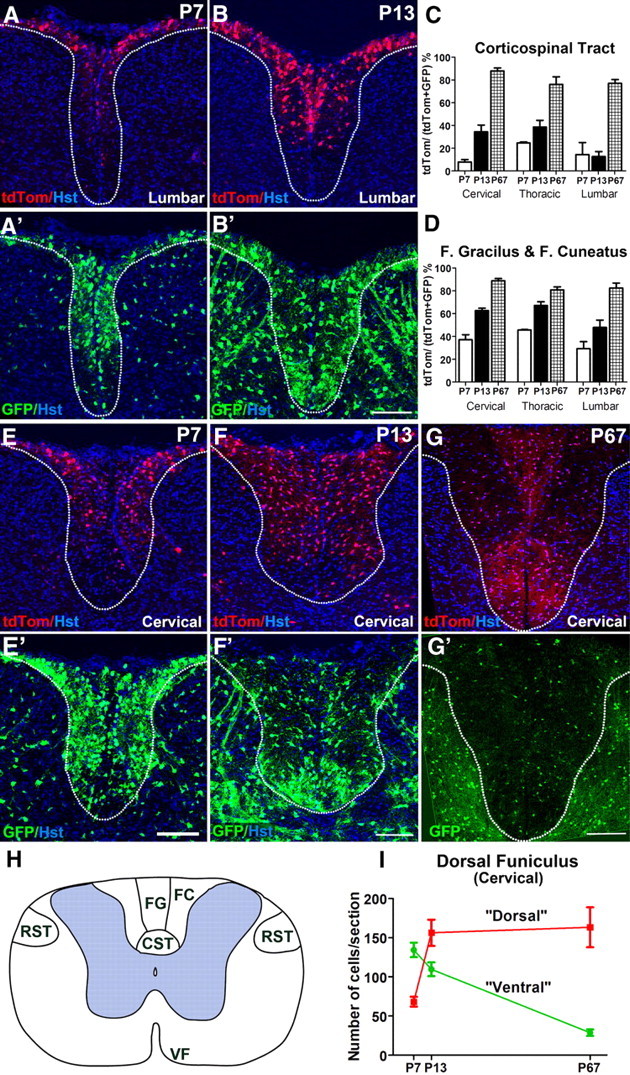
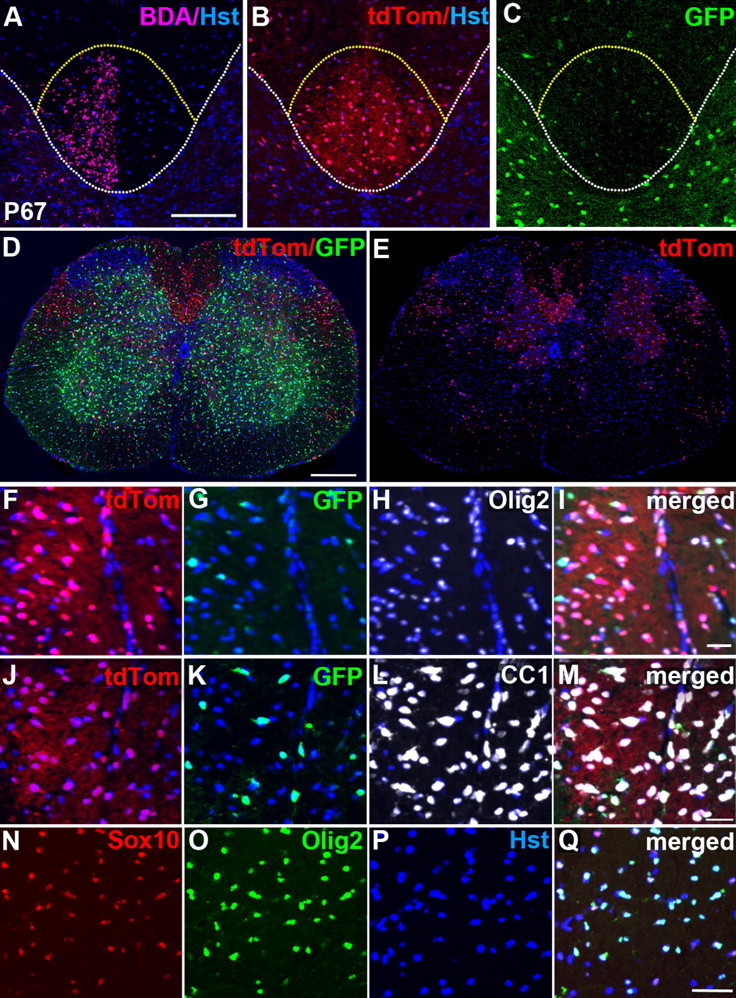
In the developing spinal cord, most oligodendrocyte precursors (OLPs) arise from the ventral ventricular zone (VZ) under the influence of Sonic Hedgehog, but a minority are generated from the dorsal VZ in a Hedgehog-independent manner. In the developing forebrain too, OLPs arise from both the ventral and the dorsal VZ. It is not known whether dorsally and ventrally derived oligodendrocyte (OL) lineage cells have different properties. We generated a dual reporter mouse line to color code ventrally and dorsally derived OLPs (vOLPs and dOLPs) and their differentiated oligodendrocyte progeny (vOLs and dOLs) for functional studies. We found that ∼80% of OL lineage cells in the postnatal spinal cord and ∼20% in the corpus callosum are ventrally derived. In both spinal cord and corpus callosum, vOLPs and dOLPs had indistinguishable electrical properties, as did vOLs and dOLs. However, vOLPs and dOLPs had different migration and settling patterns. In the spinal cord, vOLPs appeared early and spread uniformly throughout the cord, whereas dOLPs arrived later and remained mainly in the dorsal and dorsolateral funiculi. During adulthood, corticospinal and rubrospinal tracts became myelinated mainly by dOLs, even though vOLs dominated these tracts during early postnatal life. Thus, dOLPs are electrically similar to vOLPs but appear to outcompete them for dorsal axons.


Figures

Figure 1.
Figure 1.
Generation and characterization of Sox10-GFP/tdTom dual reporter mice. A, The genomic region on the Sox10 genomic PAC between exons 3 and 5 was replaced with loxP-eGFP-(polyA)4-loxP-tdTom-frt-CmR-frt. The chloramphenicol resistance cassette (CmR) was removed with Flp-recombinase (Lee et al., 2001). In the absence of Cre recombinase, only GFP is expressed since the (polyA)4 cassette effectively directs cleavage of the primary RNA transcript upstream of tdTom. In the presence of Cre, eGFP-(polyA)4 is excised and tdTom expressed instead. As expected, in the absence of Cre, expression of GFP (green) was noted in a majority of SOX10+ cells (red) in the forebrain (B–D) and spinal cord (E–G). Boxed areas in B and E are shown at higher magnification in C, D, and F, G, respectively. Cell counts at P10–P13 (H) revealed that ∼96% (n = 3 mice) of SOX10+ cells in the corpus callosum and ∼86% (n = 4 mice) of SOX10+ cells in the spinal cord white matter were GFP+ (data shown as mean ± SEM). The vast majority of GFP+ cells (green) was confirmed to be OL lineage by double immunolabeling spinal cord white matter for CC-1, which labels differentiated OLs (red, I–K), or anti-OLIG2, which labels all stages of the lineage (red, L–N). Arrows in I–K indicate GFP+ OLs that colabel with CC-1; arrowheads indicate GFP+, CC-1-negative OLPs. tdTom was not expressed in the absence of Cre (not shown). Cell nuclei were poststained with Hoechst 33258 (Hst, blue). The images in I–N were taken in the corpus callosum at P12. Scale bars: D, G, 20 μm; K, N, 25 μm.
Figure 2.
Figure 2.
The corpus callosum is populated mainly by dorsally derived OLs. Gsh2 is expressed only in the LGE and dorsal MGE (A, shown in red), whereas Emx1 is expressed in the developing dorsal telencephalon (B, shown in red). In Gsh2-Cre: Sox10-GFP/tdTom animals, the corpus callosum (CC) was populated mainly by unrecombined (green) OL lineage cells (C), and consistent with this, in Emx1-Cre: Sox10-GFP/tdTom animals, the CC was populated predominantly by recombined (red) OL lineage cells (D). Boxes in C and D are shown at higher magnification in E and F, respectively. Cell nuclei were poststained with Hoechst 33258 (Hst, blue). G, Cell counts in the CC at P12–P13 showed that ∼20% (n = 6 mice) of the labeled OL population in Gsh2-Cre: Sox10-GFP/tdTom were tdTom+, i.e., derived from MGE/LGE, whereas ∼80% (n = 5 mice) of labeled cells in the CC of Emx1-Cre: Sox10-GFP/tdTom were tdTom+, i.e., originating in the cortex. Data are presented as mean ± SEM. Scale bar: 20 μm.
Figure 3.
Figure 3.
Electrophysiological properties of ventrally and dorsally derived OLPs in the corpus callosum. A, A vOLP expressing tdTom under Sox10 transcriptional control (in Gsh2-Cre: Sox10-GFP/tdTom mice; top) was whole-cell clamped with an internal solution containing Lucifer yellow (green: middle). Bottom panel shows overlay. Top current traces are in response to 20 mV steps from −70 mV. Bottom traces are after subtraction of the linearly scaled response to the step to −110 mV. B, As in A but for a dOLP expressing eGFP under Sox10 control (in Gsh2-Cre: Sox10-GFP/tdTom mice). C, D, Comparison for vOLPs (tdTom) and dOLPs (eGFP), with and without Na+ current, of membrane capacitance (C) and membrane resistance (D) at −70 mV. E, Comparison of peak net inward current evoked in INa-expressing OLPs by a step from −70 mV to +10 mV. F, Specimen responses of an OLP to kainate (100 μm) and NMDA (60 μm) at −70 mV and to GABA (100 μm) at −40 mV. G, Magnitude of drug-evoked currents (as in E) for vOLPs and dOLPs expressing INa.
Figure 4.
Figure 4.
Comparison of the electrical properties of ventrally and dorsally derived mature OLs (vOLs and dOLs) in the forebrain. A, A vOL expressing tdTom in Gsh2-Cre: Sox10-GFP/tdTom mice (left) was whole-cell clamped with an internal solution containing Lucifer yellow (green: middle); thin green processes are internodes. Right panel shows overlay. Current traces are in response to 20 mV steps from −70 mV. B, As in A but for a dOL expressing eGFP in Gsh2-Cre: Sox10-GFP/tdTom mice; thin red processes are internodes. C, Comparison for vOLs (tdTom) and dOLs (eGFP) of membrane resistance at −70 mV. D, Percentage of vOLs (tdTom) and dOLs (eGFP) with different numbers of internodal processes (10 vOLs and 11 dOLs were studied). E, Mean number of internodal processes made by vOLs and dOLs. F, Specimen responses of an OL to kainate (100 μm) and NMDA (60 μm) at −70 mV. G, Magnitude of drug-evoked currents (as in F) for vOLs and dOLs.
Figure 5.
Figure 5.
Dorsally and ventrally derived OL lineage cells in the spinal cord have similar electrical properties. A–C, Origin and location of spinal dOLPs and vOLPs. A, In the developing spinal cord Msx3 is expressed in dorsal domains dP1–dP5, whereas Gsh2 is expressed only in dP3–dP5. Hence, Msx3-Cre: Sox10-GFP/tdTom was used to examine dorsally derived OL lineage cells in the spinal cord. B, C, At P13, ventrally derived OLPs and OLs (green) are evenly spread throughout the spinal cord (B), whereas dorsally derived OL lineage cells (red) are mainly restricted to the dorsal and dorsolateral regions of the cord (C) (images are of cervical cord; see also Fig. 6H). Very few dorsally derived cells were observed in the ventral funiculus. Note that the dorsal funiculus is dominated by dorsally derived (red) cells except for the ventralmost part (CSTs), where ventrally derived (green) cells are more abundant. In contrast, in the dorsolateral funiculus, where the RSTs run, there appears to be an accumulation of dorsally derived cells. Cell nuclei were poststained with Hoechst 33258 (Hst, blue). D–I, Electrical properties of spinal dorsally and ventrally derived OL lineage cells. D, Membrane capacitance of dorsal (tdTom-expressing) and ventral (eGFP-expressing) OLP morphology cells. E, Membrane resistance at −70 mV of OLP morphology cells with and without INa and of mature OLs. F, Peak inward current evoked by depolarization from −70 mV to +10 mV in OLPs with INa. G, Percentage of dOLs and vOLs with different numbers of internodal processes (13 dOLs and 22 vOLs were studied). H, Mean number of internodal processes made by dOLs and vOLs. I, Drug-evoked currents in OLPs with INa. J, Drug-evoked currents in mature OLs.
Figure 6.
Figure 6.
The corticospinal tract is populated mainly by dorsally derived OL lineage cells in adulthood. A, A′, There are very few OL lineage cells in the CST at P7 in the lumbar cord, and almost none of these are dorsally derived (red). B, B′, At P13, the CST at lumbar level still has very few dorsally derived OL lineage cells (red) (B), but contains many more ventrally derived (green) cells (B′). This situation reverses by P67, when the entire dorsal funiculus (DF), especially the CST, is populated mainly by dorsally derived OLPs and OLs as revealed by cell counts (C, D). The situation at thoracic and cervical spinal levels is very similar. E, E′, At P7, a majority of cells in the DF and especially the CST are ventrally derived (green). By P13, the numbers of dorsally derived (red) cells increases in the DF (F), but the CST is still mainly populated by dorsally derived cells (green, F′). The proportions of tdTom+ (dorsally derived) cells in the CST, fasciculus gracilis, and fasciculus cuneatus increase steadily from P7 to adulthood at all spinal levels (C, D). Three sections per spinal level were counted for each animal: P7 (n = 2 mice) (E, E′), P13 (n = 3) (F, F′), and P67 (n = 3) (G, G′). H, Drawing of the adult spinal cord showing the tracts and regions examined (VF, ventral funiculus). I, The absolute numbers of GFP+ (ventrally derived) cells/section in the dorsal funiculus (cervical level) decrease dramatically between P7 and P67, while tdTom+ (dorsally derived) cells increase in number during the same time frame. The images in A and B are of the lumbar spinal cord; all other images are of the cervical cord. Scale bars, 100 μm.
Figure 7.
Figure 7.
The Sox10-GFP/tdTom reporter faithfully identifies OL lineage cells in the adult. A–C, BDA labeling confirmed that the majority of presumptive OL lineage cells in the adult CST are of dorsal origin (tdTom+). The white dotted line separates gray matter from white matter and the yellow dotted line outlines the CST. D, E, A cross-sectional image of an adult Msx3-Cre: Sox10-GFP/tdTom spinal cord shows that the dorsal funiculus (especially the CST) and dorsolateral funiculi (RST) contain mainly dorsally derived tdTom+ cells. tdTom+ (F, red) and GFP+ (G, green) cells together account for the great majority of OLIG2+ cells (H–I) in the adult spinal white matter. In addition, most CC-1+ differentiated OLs (L–M) colabeled for either tdTom (red, J) or GFP (green, K), confirming that the Sox10-GFP/tdTom reporter faithfully identifies OL lineage cells in the adult cord and also that we did not “lose” a significant number of OL lineage cells in adulthood because of reduced GFP or tdTom expression. Almost all SOX10+ cells (red, N) also colabel for OLIG2 (green, O–Q) and vice versa in the adult spinal cord. Cell nuclei were poststained with Hoechst 33258 (Hst, blue). All images were taken from the cervical spinal cord. The images in F–Q were taken within the CST. Scale bars: A, 100 μm; D, 250 μm; I, M, 25 μm; Q, 35 μm.

References

    1. Anderson ES. Morphology of early developing oligodendrocytes in the ventrolateral spinal cord of the chicken. J Neurocytol. 2003;32:1045–1053. - PubMed
    1. Anderson ES, Bjartmar C, Hildebrand C. Myelination of prospective large fibres in chicken ventral funiculus. J Neurocytol. 2000;29:755–764. - PubMed
    1. Bakiri Y, Káradóttir R, Cossell L, Attwell D. Morphological and electrical properties of oligodendrocytes in the white matter of the corpus callosum and cerebellum. J Physiol. 2011;589:559–573. - PMC - PubMed
    1. Bareyre FM, Kerschensteiner M, Misgeld T, Sanes JR. Transgenic labeling of the corticospinal tract for monitoring axonal responses to spinal cord injury. Nat Med. 2005;11:1355–1360. - PubMed
    1. Bjartmar C, Hildebrand C, Loinder K. Morphological heterogeneity of rat oligodendrocytes: electron microscopic studies on serial sections. Glia. 1994;11:235–244. - PubMed

Publication types

LinkOut - more resources