. 2011 May 4;31(18):6820-30.
doi: 10.1523/JNEUROSCI.6491-10.2011.

Roles of nucleus accumbens core and shell in incentive-cue responding and behavioral inhibition

Affiliations

Roles of nucleus accumbens core and shell in incentive-cue responding and behavioral inhibition

Frederic Ambroggi et al. J Neurosci. .

Abstract

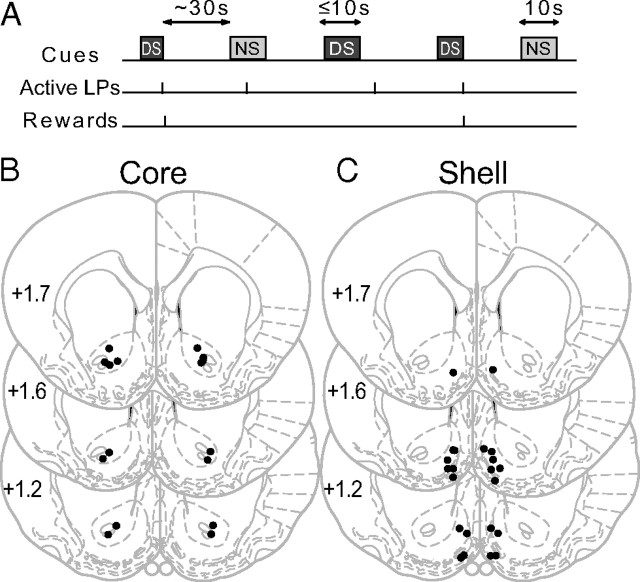
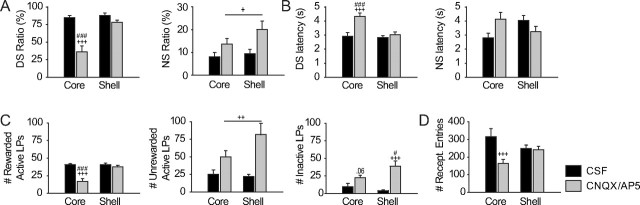
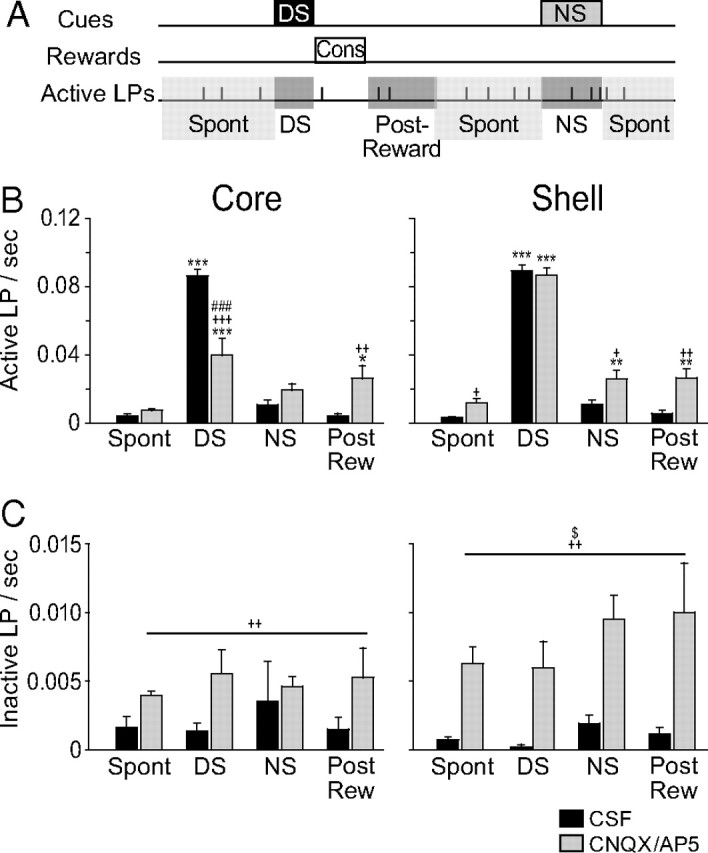
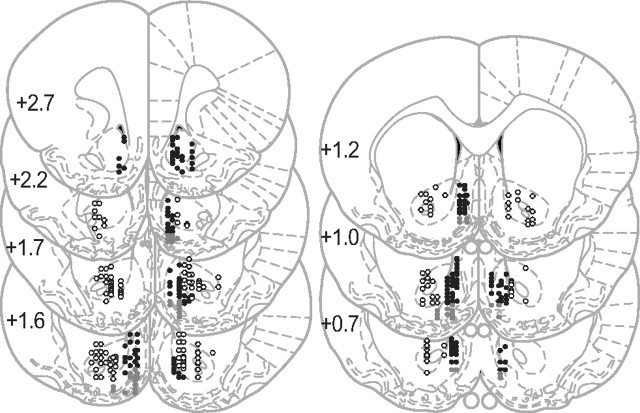
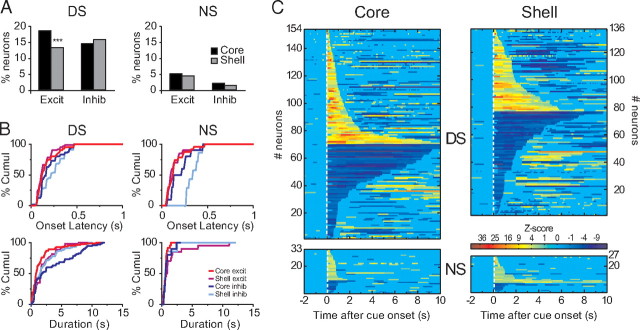
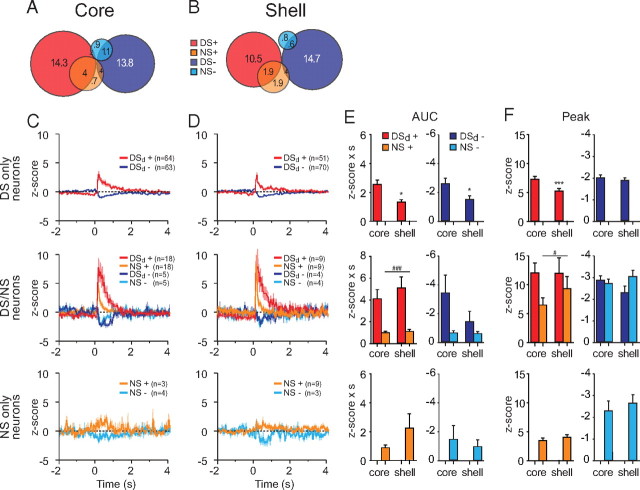
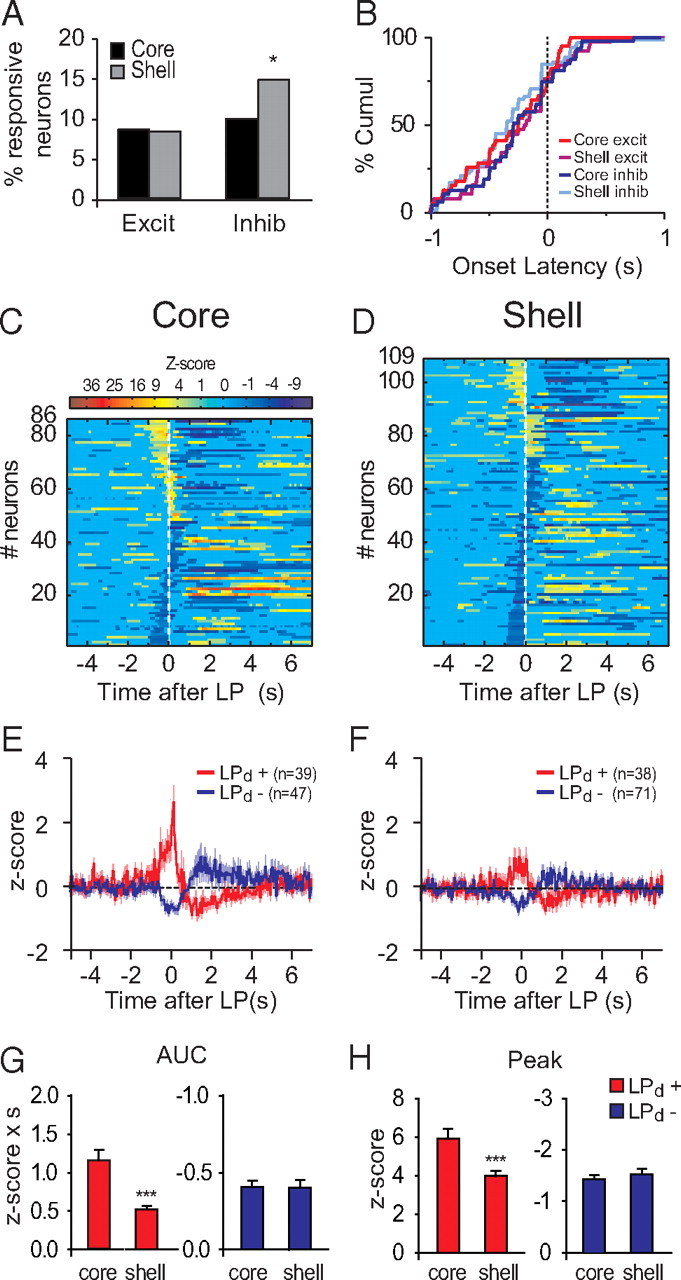
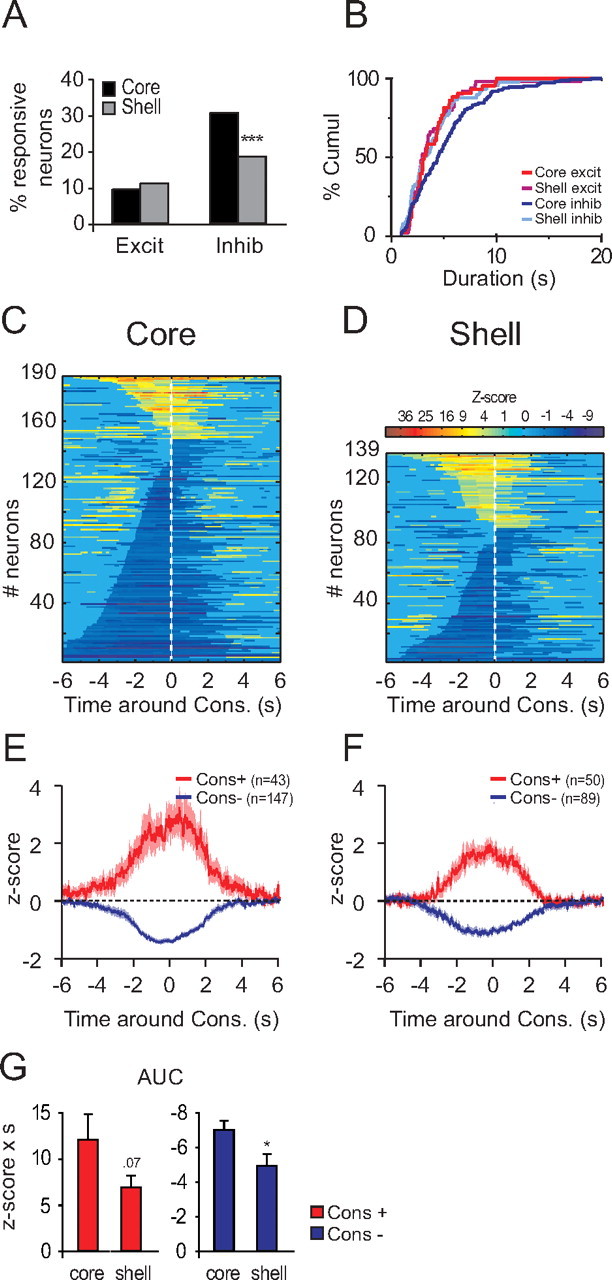
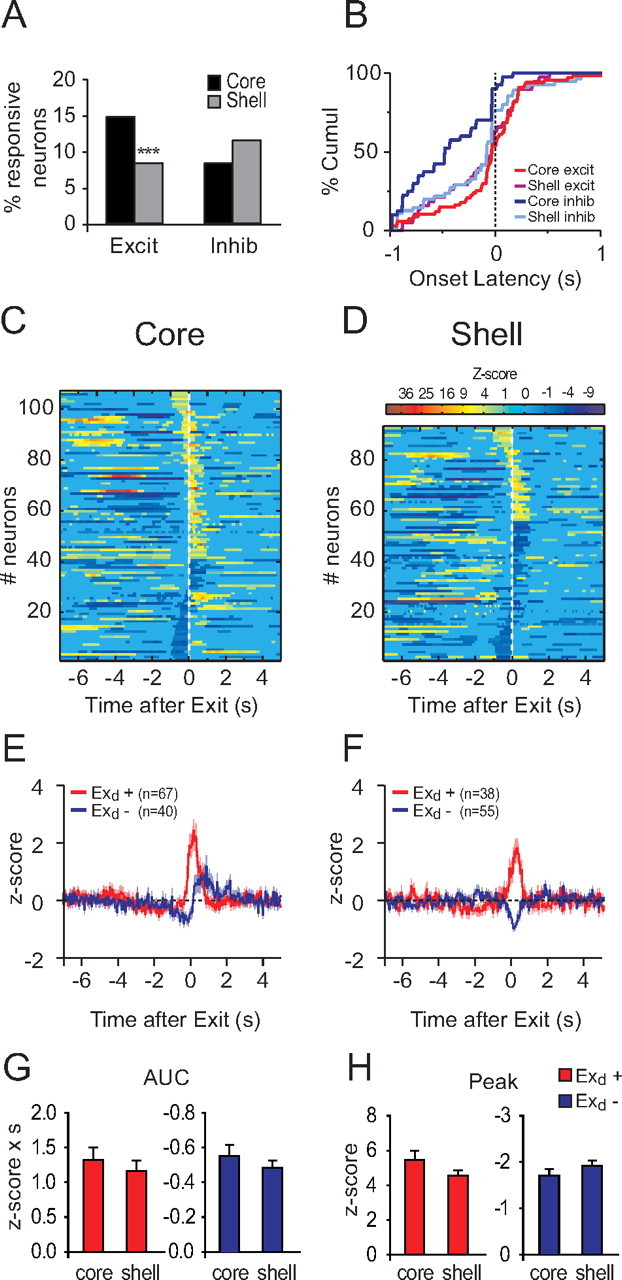
The nucleus accumbens (NAc) is involved in many reward-related behaviors. The NAc has two major components, the core and the shell. These two areas have different inputs and outputs, suggesting that they contribute differentially to goal-directed behaviors. Using a discriminative stimulus (DS) task in rats and inactivating the NAc by blocking excitatory inputs with glutamate antagonists, we dissociated core and shell contributions to task performance. NAc core but not shell inactivation decreased responding to a reward-predictive cue. In contrast, inactivation of either subregion induced a general behavioral disinhibition. This reveals that the NAc actively suppresses actions inappropriate to the DS task. Importantly, selective inactivation of the shell but not core significantly increased responding to the nonrewarded cue. To determine whether the different contributions of the NAc core and shell depend on the information encoded in their constituent neurons, we performed electrophysiological recording in rats performing the DS task. Although there was no firing pattern unique to either core or shell, the reward-predictive cue elicited more frequent and larger magnitude responses in the NAc core than in the shell. Conversely, more NAc shell neurons selectively responded to the nonrewarded stimulus. These quantitative differences might account for the different behavioral patterns that require either core or shell. Neurons with similar firing patterns could also have different effects on behavior due to their distinct projection targets.


Figures

Figure 1.
Figure 1.
Schematic of the DS task and histology. A, Two cue tones [up to 10 s for the rewarded discriminative stimulus (DS); 10 s for the unrewarded stimulus (NS)] were randomly presented on a variable-interval schedule with an average interval of 30 s. A lever press was required during DS presentation to terminate the DS and cause the delivery of a 10% sucrose reward into an adjacent receptacle. B, C, Histological reconstruction of injector placements in the core (B) and the shell (C).
Figure 2.
Figure 2.
Effect of pharmacological inactivation (CNQX/AP5, 1 and 2 μg/0.5 μl, respectively) of the NAc core and shell on the DS task. A, Average DS (left) and NS (right) response ratios (proportion of DSs or NSs during which the animal pressed the lever). B, Average DS (left) and NS (right) response latencies (time from cue onset to the lever press). C, Average number of rewarded (i.e., occurring during DS presentations, left) and unrewarded (outside DS presentations, middle) lever presses on the active and total number of lever presses on the inactive lever (right). D, Average number of reward receptacle entries. +p < 0.05, ++p < 0.01, +++p < 0.001 compared to CSF injections and #p < 0.05, ###p < 0.001 compared to shell injections.
Figure 3.
Figure 3.
Time window analysis of lever pressing after pharmacological inactivation of the NAc core and shell. A, Schematic illustrating the time windows in which the frequency of lever pressing was analyzed. DS and NS windows correspond to the entire duration of the cues. The postreward window corresponds to the 10 s following the consumption of the reward. The spontaneous window (spon) corresponds to the remaining time. B, C, Frequency of active (B) and inactive (C) lever pressing in the different time windows after CSF or CNQX/AP5 injections in the core (left) or the shell (right). *p < 0.05, **p < 0.01, ***p < 0.001 compared to the spontaneous window; +p < 0.05, ++p < 0.01, +++p < 0.001 compared to CSF injections and #p < 0.05, ##p < 0.01, ###p < 0.001 compared to shell injections, $p < 0.05 structure × injection effect.
Figure 4.
Figure 4.
Histological reconstruction of electrode placements in the NAc core (open circles) and shell (black and gray dots). Gray dots represent the electrode sites close to the ventral pallidum that were included in the shell data.
Figure 5.
Figure 5.
Neuronal responses to the DS and NS in the NAc. A, Percentage of excitation and inhibition in response to the DS (left) and NS (right). B, Cumulative percentage of onset response latency (top) and response duration (bottom) for DS (left) and NS (right). C, Normalized (as z-score) and color-coded PSTH showing all DS- (top) and NS- (bottom) responsive neurons. Each line represents the PSTH of a single neuron. Cue-excited neurons are displayed at the top and cue-inhibited neurons at the bottom. Within each category, neurons are sorted by response durations (shorter responses at the top for excitations and at the bottom for inhibitions). Deconvolution of PSTHs was not used for the analyses in this figure.
Figure 6.
Figure 6.
Overlaps between DS and NS responses. A, B, Venn diagram showing the proportion of DS-excited (red), DS-inhibited (dark blue), NS-excited (orange), and NS-inhibited (light blue) responses for the core (A) and the shell (B). The overlaps represent the neurons having two types of responses. C, D, Average responses to DS and/or NS in the core (C) and the shell (D). Top, Neurons responding only to DS. Middle, Neurons responding to both DS and NS with the same response direction (excitation or inhibition). Bottom, Neurons responding only to NS. E, F, AUC (E) and peak (F) of DS and/or NS responses. *p < 0.05 structure effect, ###p < 0.001 cue effect.
Figure 7.
Figure 7.
Neuronal responses to rewarded lever presses. A, Percentage of excitation and inhibition in response to the lever press in the core and the shell. B, Cumulative percentage of onset latency of lever press-related responses. C, D, Normalized and color-coded PSTHs aligned to the lever press for core (C) and shell (D). Each line represents the PSTH of a single neuron. LP-excited neurons are displayed at the top and LP-inhibited neurons at the bottom. Within each category, neurons are sorted by response durations (shorter responses at the top for excitations and at the bottom for inhibitions). E, F, Average lever-press responses for core (E) and shell (F) neurons. G, H, Peak (G) and AUC (H) of lever-press responses. ***p < 0.01 compared to core.
Figure 8.
Figure 8.
Neuronal responses to reward consumption. A, Percentage of excitation and inhibition in response to the reward consumption in the core and the shell. B, Cumulative percentage of response duration of consumption-related responses. C, D, Normalized and color-coded PSTHs aligned to the middle of the reward consumption for core (C) and shell (D). Consumption-excited neurons are displayed at the top and consumption-inhibited neurons at the bottom. Within each category, neurons are sorted by response durations (shorter responses at the top for excitations and at the bottom for inhibitions). E, F, Average response for consumption-responsive neurons in the core (E) and shell (F). G, AUC of consumption responses. *p < 0.05, ***p < 0.01, compared to core.
Figure 9.
Figure 9.
Neuronal responses to reward receptacle exit. A, Percentage of excitation and inhibition in response to the reward receptacle exit in the core and the shell. B, Cumulative percentage of onset latency of reward receptacle exit-related responses. C, D, Normalized and color-coded PSTHs aligned to the middle of the reward receptacle exit for core (C) and shell (D). Reward receptacle exit-excited neurons are displayed at the top and reward receptacle exit-inhibited neurons at the bottom. Within each category, neurons are sorted by response durations (shorter responses at the top for excitations and at the bottom for inhibitions). E, F, Average receptacle-exit responses for core (E) and shell (F) neurons. G, H, Peak (G) and AUC (H) of receptacle-exit responses. ***p < 0.01 compared to core.

Similar articles

Cited by

References

    1. Ambroggi F, Ishikawa A, Fields HL, Nicola SM. Basolateral amygdala neurons facilitate reward-seeking behavior by exciting nucleus accumbens neurons. Neuron. 2008;59:648–661. - PMC - PubMed
    1. Bowman EM, Aigner TG, Richmond BJ. Neural signals in the monkey ventral striatum related to motivation for juice and cocaine rewards. J Neurophysiol. 1996;75:1061–1073. - PubMed
    1. Cardinal RN, Parkinson JA, Hall J, Everitt BJ. Emotion and motivation: the role of the amygdala, ventral striatum, and prefrontal cortex. Neurosci Biobehav Rev. 2002;26:321–352. - PubMed
    1. Chaudhri N, Sahuque LL, Schairer WW, Janak PH. Separable roles of the nucleus accumbens core and shell in context- and cue-induced alcohol-seeking. Neuropsychopharmacology. 2010;35:783–791. - PMC - PubMed
    1. Cromwell HC, Schultz W. Effects of expectations for different reward magnitudes on neuronal activity in primate striatum. J Neurophysiol. 2003;89:2823–2838. - PubMed

Publication types

LinkOut - more resources