. 2011 Aug;301(2):R421-9.
doi: 10.1152/ajpregu.00095.2011. Epub 2011 May 4.

Gut sensing of dietary K⁺ intake increases renal K⁺excretion

Affiliations

Gut sensing of dietary K⁺ intake increases renal K⁺excretion

Ki-Sook Oh et al. Am J Physiol Regul Integr Comp Physiol. 2011 Aug.

Abstract

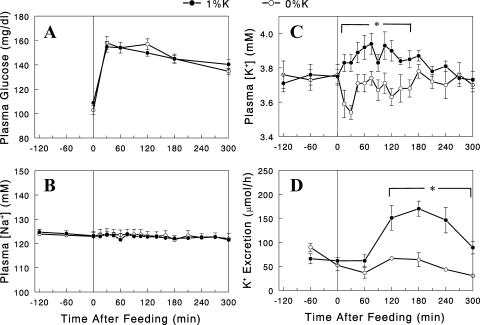
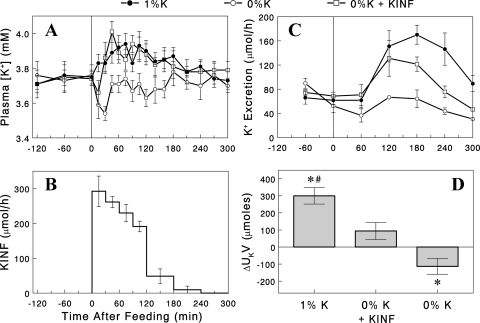
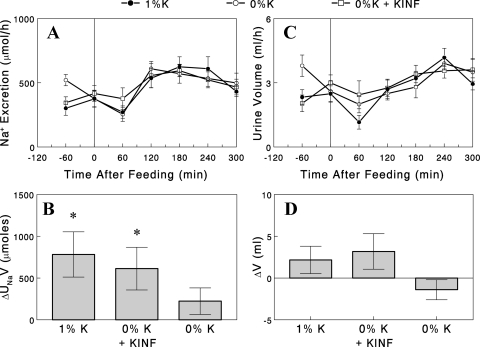
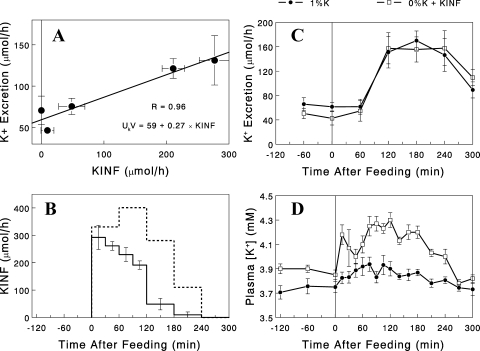
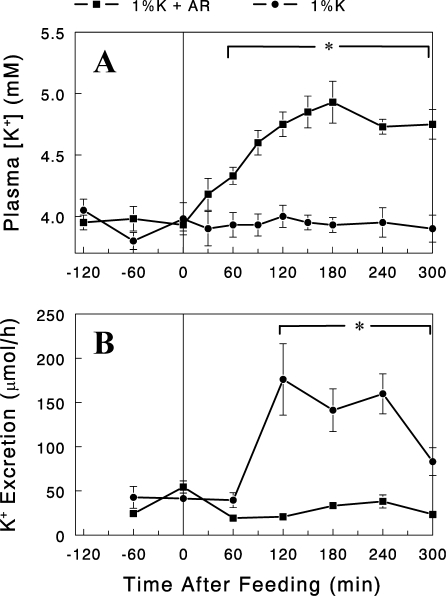
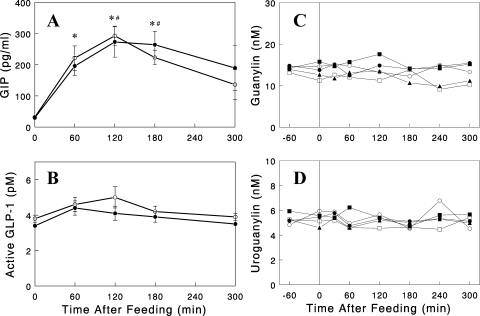
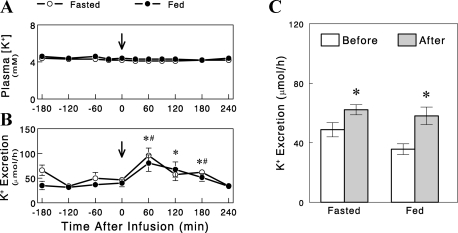
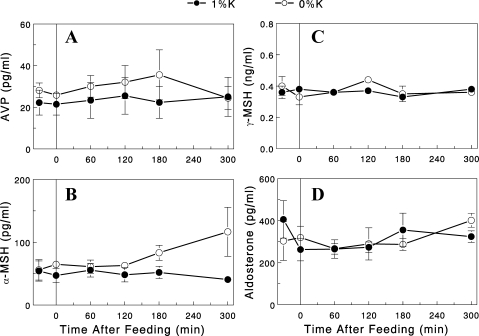
Dietary K(+) intake may increase renal K(+) excretion via increasing plasma [K(+)] and/or activating a mechanism independent of plasma [K(+)]. We evaluated these mechanisms during normal dietary K(+) intake. After an overnight fast, [K(+)] and renal K(+) excretion were measured in rats fed either 0% K(+) or the normal 1% K(+) diet. In a third group, rats were fed with the 0% K(+) diet, and KCl was infused to match plasma [K(+)] profile to that of the 1% K(+) diet group. The 1% K(+) feeding significantly increased renal K(+) excretion, associated with slight increases in plasma [K(+)], whereas the 0% K(+) diet decreased K(+) excretion, associated with decreases in plasma [K(+)]. In the KCl-infused 0% K(+) diet group, renal K(+) excretion was significantly less than that of the 1% K(+) group, despite matched plasma [K(+)] profiles. We also examined whether dietary K(+) alters plasma profiles of gut peptides, such as guanylin, uroguanylin, glucagon-like peptide 1, and glucose-dependent insulinotropic polypeptide, pituitary peptides, such as AVP, α-MSH, and γ-MSH, or aldosterone. Our data do not support a role for these hormones in the stimulation of renal K(+) excretion during normal K(+) intake. In conclusion, postprandial increases in renal K(+) excretion cannot be fully accounted for by changes in plasma [K(+)] and that gut sensing of dietary K(+) is an important component of the regulation of renal K(+) excretion. Our studies on gut and pituitary peptide hormones suggest that there may be previously unknown humoral factors that stimulate renal K(+) excretion during dietary K(+) intake.


Figures

Fig. 1.
Fig. 1.
Plasma glucose (A), Na+ (B), and K+ (C) concentrations and renal K+ excretion (D) profiles during the 2-h basal (−120 to 0 min) and 5-h postprandial (0 to 300 min) periods in overnight-fasted rats given the 0% (○) or 1% (●) K+ diet. Data are expressed as means ± SE for 7 or 8 experiments. *P < 0.05 vs. 0% K+ diet.
Fig. 2.
Fig. 2.
A: plasma [K+] profiles with the 1% (●) or 0% K+ diet with (□), or without (○) K+ infusion (KINF) to match plasma [K+] profile to that of the 1% K+ group. B: K+ infusion profile used. C: renal K+ excretion profiles in the three groups. D: increases in renal K+ excretion above basal rates. Data are expressed as means ± SE for 7 or 8 experiments. *P < 0.05 vs. zero (i.e., no increase); #P < 0.05 vs. the other groups.
Fig. 3.
Fig. 3.
A: renal Na+ excretion profiles with the 1% (●) or 0% K+ diet with (□) or without (○) K+ infusion (KINF). B: increases in renal Na+ excretion above basal rates. C: urine flow in the three groups. D: increases in urine flow above basal rates. Data are expressed as means ± SE for 7 or 8 experiments. *P < 0.05 vs. zero (i.e., no increase).
Fig. 4.
Fig. 4.
A: linear relationship between KINF and renal K+ excretion (measured after 1 h) rates in rats fed the 0% K+ diet (data from Fig. 2, B and C). B: KINF profile (dashed line) predicted to produce renal K+ excretion rates matching those with the 1% K+ diet (Fig. 2C), compared with the profile used in the earlier experiment. C and D: renal K+ excretion and plasma [K+] profiles, respectively, in rats fed the 0% K+ diet and infused with K+, according to the new KINF profile (□), compared with the data with the 1% K+ diet (●; from Fig. 2, A and C). Data are expressed as means ± SE for 6–8 experiments.
Fig. 5.
Fig. 5.
Plasma K+ concentrations (A) and renal K+ excretion rates (B) after the 1% K+ diet with (■) or without (●) amiloride (AR) infusion (2 nmol/min, intravenous) started at the beginning of the feeding (t=0). Data are expressed as means ± SE for 4 experiments. *P < 0.05 between the groups.
Fig. 6.
Fig. 6.
Plasma glucose-dependent insulinotropic polypeptide (GIP; A), glucagon-like peptide 1 (GLP-1; B), guanylin (C), and uroguanylin (D) profiles in overnight-fasted rats after the 0% (○) or 1% (●) K+ diet. A and B: data are expressed as means ± SE for 5 experiments for each group. *#Significant changes (P < 0.05) from basal (i.e., t=0) in the 0% and the 1% K+ diet group, respectively. C and D: data from individual rats are shown with open symbols representing the 0% K+ diet group, and solid symbols the 1% K+ diet group (n=2 and 3, respectively).
Fig. 7.
Fig. 7.
Plasma [K+] (A) and renal K+ excretion (B) profiles in overnight-fasted rats before and after an 1-min infusion of pituitary extracts from overnight-fasted rats (○) or overnight-fasted rats refed for 2 h with normal 1% K+ diet (●). C: average K+ excretion rates before and after the infusion of pituitary extracts. Data are expressed as means ± SE for 5 experiments. B: *#Significant changes (P < 0.05, one-tail t-test) from average K+ excretion before the infusion in the fed and the fasted group, respectively. C: *P < 0.05 vs. before.
Fig. 8.
Fig. 8.
Plasma AVP (A), α-MSH (B), γ-MSH (C), and aldosterone (D) profiles in overnight-fasted rats after the 0% (○) or 1% (●) K+ diet. Data are expressed as means ± SE for 4 or 5 experiments for each group.

References

    1. Ahren B. GLP-1 and extra-islet effects. Horm Metab Res 36: 842–845, 2004 - PubMed
    1. Bia MJ, DeFronzo RA. Extrarenal potassium homeostasis. Am J Physiol Renal Fluid Electrolyte Physiol 240: F257–F268, 1981 - PubMed
    1. Calo L, Borsatti A, Favaro S, Rabinowitz L. Kaliuresis in normal subjects following oral potassium citrate intake without increased plasma potassium concentration. Nephron 69: 253–258, 1995 - PubMed
    1. Choi CS, Lee FN, McDonough AA, Youn JH. Independent regulation of in vivo insulin action on glucose versus K+ uptake by dietary fat and K+ content. Diabetes 51: 915–920, 2002 - PubMed
    1. Choi CS, Thompson CB, Leong PK, McDonough AA, Youn JH. Short-term K+ deprivation provokes insulin resistance of cellular K+ uptake revealed with the K+ clamp. Am J Physiol Renal Physiol 280: F95–F102, 2001 - PubMed

Publication types