. 2011 May 24;108(21):8737-42.
doi: 10.1073/pnas.1105364108. Epub 2011 May 4.

A cluster of coregulated genes determines TGF-beta-induced regulatory T-cell (Treg) dysfunction in NOD mice

Affiliations

A cluster of coregulated genes determines TGF-beta-induced regulatory T-cell (Treg) dysfunction in NOD mice

Anna Morena D'Alise et al. Proc Natl Acad Sci U S A. .

Abstract

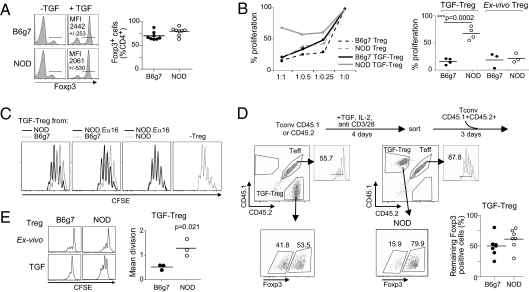
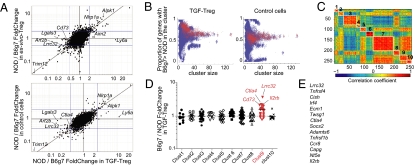
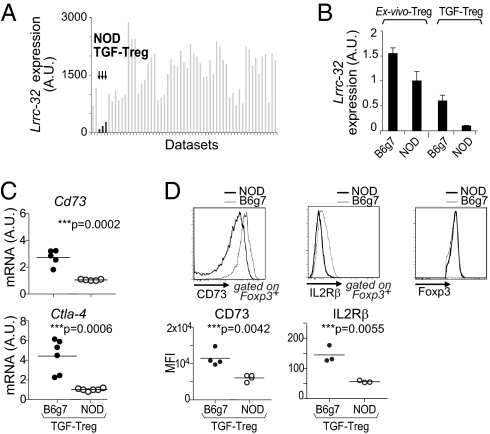
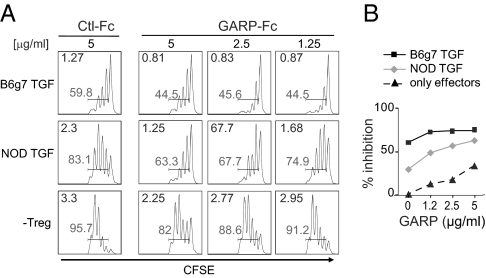
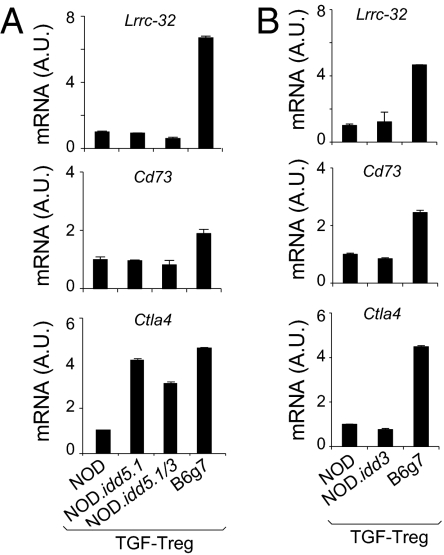
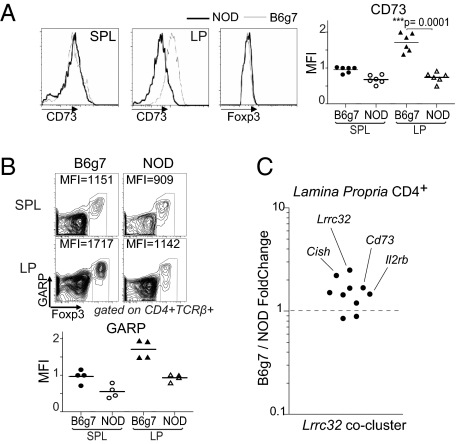
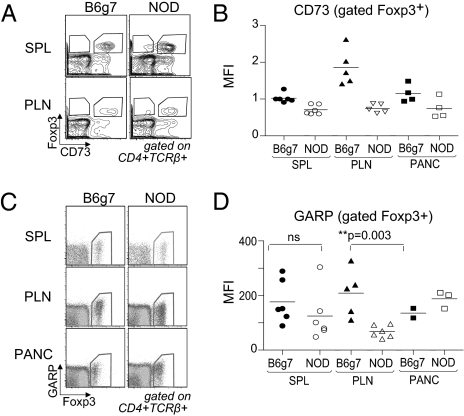
Foxp3(+) regulatory T cells (Tregs) originate in the thymus, but the Treg phenotype can also be induced in peripheral lymphoid organs or in vitro by stimulation of conventional CD4(+) T cells with IL-2 and TGF-β. There have been divergent reports on the suppressive capacity of these TGF-Treg cells. We find that TGF-Tregs derived from diabetes-prone NOD mice, although expressing normal Foxp3 levels, are uniquely defective in suppressive activity, whereas TGF-Tregs from control strains (B6g7) or ex vivo Tregs from NOD mice all function normally. Most Treg-typical transcripts were shared by NOD or B6g7 TGF-Tregs, except for a small group of differentially expressed genes, including genes relevant for suppressive activity (Lrrc32, Ctla4, and Cd73). Many of these transcripts form a coregulated cluster in a broader analysis of T-cell differentiation. The defect does not map to idd3 or idd5 regions. Whereas Treg cells from NOD mice are normal in spleen and lymph nodes, the NOD defect is observed in locations that have been tied to pathogenesis of diabetes (small intestine lamina propria and pancreatic lymph node). Thus, a genetic defect uniquely affects a specific Treg subpopulation in NOD mice, in a manner consistent with a role in determining diabetes susceptibility.


Conflict of interest statement

The authors declare no conflict of interest.

Figures

Fig. 1.
Fig. 1.
Lower functional efficacy of TGF-Tregs from NOD mice. (A) Foxp3 staining of naive T cells from NOD and B6g7 mice cultured in absence (−TGF) or presence of TGF-β (+TGF). Mean fluorescence intensity (MFI) was calculated. (B) Proliferation of T effector cells (Teff) at titrated ratio Treg:Teff as tested in thymidine incorporation assays, in presence of NOD or B6g7 TGF-Treg and respective ex vivo Tregs. (Right) Compilation of results from four independent experiments at ratio 1:1 Treg:Teff. (C) Proliferation of Teffs in presence of B6g7, NOD, or NOD.Eα16 TGF-Tregs (n = 3). (D) NOD (CD45.1+) or B6g7 (CD45.2+) naive Tconv cells were cultured in presence of IL-2, anti-CD3/28–coated beads, and TGF-β. After 4 d, Foxp3+ cells were sorted and cultured with CD45.1+CD45.2+ (NOD × B6g7) F1 Teffs that were CFSE labeled. Proliferation of Teffs was analyzed 3 d later. The percentage of remaining NOD and B6g7 TGF-Treg Foxp3+ cells was calculated. (E) Proliferation of anti-CD3/28–activated NOD and B6g7 TGF-Tregs and respective ex vivo Tregs measured by CFSE dilution. Mean division was calculated (n = 3).
Fig. 2.
Fig. 2.
Differential gene expression in NOD and B6g7 TGF-Tregs. (A) Fold change/fold change plot depicting the NOD/B6g7 ratio of expression for TGF-Tregs (x axis) and for ex vivo Tregs (y axis, Upper) or control cells cultured in absence of TGF-β (y axis, Lower). (B) k-means clustering on the Treg signature for k ranging from 5:30 with 100 repetitions each. Clusters are depicted as a dot, and red dots denote the clusters that include Lrrc32. The plots show the proportion of genes with B6g7 > NOD expression in TGF-Tregs and in control cells as a function of cluster size. (C) Cluster analysis of expression correlation between Treg signature genes (258 genes), clustered by a k-mean cluster algorithm. Red represents positive correlation and blue negative correlation; a representative clustering result for k = 10 is shown. Each cluster is identified with a number from 1 to 10. (D) NOD/B6g7 ratio of expression for TGF-Tregs for each cluster (1–10) as shown in B. (E) List of transcripts most often associated with the Lrrc32 cluster, whose expression ratio for B6g7/NOD TGF Tregs is >1.5 fold.
Fig. 3.
Fig. 3.
NOD TGF-Tregs express lower levels of GARP. (A) Lrrc32 expression shown as arbitrary units (A.U.) across Foxp3+ T-cell microarray datasets. (B) Lrrc32 mRNA levels in NOD vs. B6g7 TGF-Tregs and respective ex vivo Tregs quantified by qPCR. (C) Cd73 and Ctla-4 mRNA levels in NOD vs. B6g7 TGF-Tregs quantified by qPCR. (D) Levels of CD73, IL2rb, and Foxp3 expressed by NOD or B6g7 TGF-Tregs and quantified as MFI (Lower).
Fig. 4.
Fig. 4.
Effect of GARP-Fc recombinant protein in suppression assay. (A) Proliferation of CFSE-labeled Teffs at ratio 1:1 with NOD or B6g7 TGF-Tregs in absence (Ctl-Fc) or presence of GARP-Fc protein. The percentage of proliferating cells (shaded numbers) and mean division (upper left of each graph) are calculated. (B) Quantification of Teffs inhibition by NOD or B6g7 TGF-Tregs in presence of an increasing amount of GARP.
Fig. 5.
Fig. 5.
The defect of the Lrrc32 cluster in NOD TGF-Tregs does not map to idd5 and idd3 regions. (A and B) Levels of Lrrc32, Cd73, and Ctla4 assessed by qPCR in NOD, B6g7, NOD.idd5.1, and NOD.Idd5.1/3 TGF-Tregs (A) and NOD.idd3 TGF-Tregs (B).
Fig. 6.
Fig. 6.
GARP-cluster expression in LP. (A) Expression of CD73 on gated CD4+Foxp3+ cells isolated from spleen and LP of NOD and B6g7 mice. (Right) Compilation of data from independent experiments. (B) Cells isolated from spleen and LP of NOD and B6g7 mice were activated for 12 h in presence of anti-CD3 and then stained for Foxp3 and GARP. Numbers in dot plots indicate MFI calculated on Foxp3+ cells. GARP levels were expressed as MFI values normalized on spleen (n = 4, Lower). (C) Ratio of expression for B6g7 vs. NOD lamina propria CD4+ T cells of Lrrc32 cluster genes.
Fig. 7.
Fig. 7.
CD73 and GARP expression by FoxP3+ Tregs at the sites of inflammation. (A) CD73 and Foxp3 expression on gated CD4+TCR-β+ T cells isolated from spleen and PLN of BDC2.5.NOD and BDC2.5.B6g7 mice. (B) Levels of CD73 in spleen, PLN, and pancreas were quantified as MFI from three independent experiments. (C) Flow cytometry of GARP and Foxp3 expression among gated CD4+TCRβ+ cells from spleen, PLN, and pancreas of BDC2.5.NOD and BDC2.5.B6g7 mice. (D) Levels of GARP, indicated as MFI on gated Foxp3+ T cells.

References

    1. Salomon B, et al. B7/CD28 costimulation is essential for the homeostasis of the CD4+CD25+ immunoregulatory T cells that control autoimmune diabetes. Immunity. 2000;12:431–440. - PubMed
    1. Tarbell KV, Yamazaki S, Olson K, Toy P, Steinman RM. CD25+ CD4+ T cells, expanded with dendritic cells presenting a single autoantigenic peptide, suppress autoimmune diabetes. J Exp Med. 2004;199:1467–1477. - PMC - PubMed
    1. Tang Q, et al. In vitro-expanded antigen-specific regulatory T cells suppress autoimmune diabetes. J Exp Med. 2004;199:1455–1465. - PMC - PubMed
    1. Herman AE, Freeman GJ, Mathis D, Benoist C. CD4+CD25+ T regulatory cells dependent on ICOS promote regulation of effector cells in the prediabetic lesion. J Exp Med. 2004;199:1479–1489. - PMC - PubMed
    1. Chen Z, Herman AE, Matos M, Mathis D, Benoist C. Where CD4+CD25+ T reg cells impinge on autoimmune diabetes. J Exp Med. 2005;202:1387–1397. - PMC - PubMed

Publication types

Substances