. 2011 Aug;301(2):C327-35.
doi: 10.1152/ajpcell.00093.2011. Epub 2011 May 4.

Cholinergic and glutamatergic agonists induce gamma frequency activity in dorsal subcoeruleus nucleus neurons

Affiliations

Cholinergic and glutamatergic agonists induce gamma frequency activity in dorsal subcoeruleus nucleus neurons

Christen Simon et al. Am J Physiol Cell Physiol. 2011 Aug.

Abstract

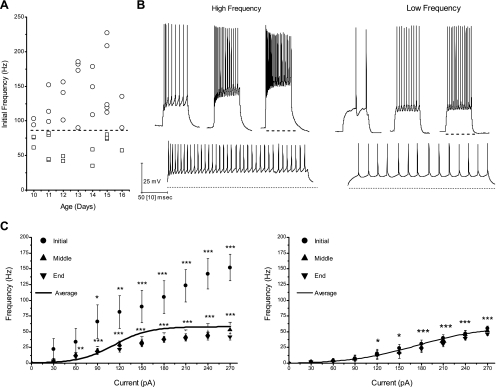
The dorsal subcoeruleus nucleus (SubCD) is involved in generating two signs of rapid eye movement (REM) sleep: muscle atonia and ponto-geniculo-occipital (PGO) waves. We tested the hypothesis that single cell and/or population responses of SubCD neurons are capable of generating gamma frequency activity in response to intracellular stimulation or receptor agonist activation. Whole cell patch clamp recordings (immersion chamber) and population responses (interface chamber) were conducted on 9- to 20-day-old rat brain stem slices. All SubCD neurons (n = 103) fired at gamma frequency when subjected to depolarizing steps. Two statistically distinct populations of neurons were observed, which were distinguished by their high (>80 Hz, n = 24) versus low (35-80 Hz, n = 16) initial firing frequencies. Both cell types exhibited subthreshold oscillations in the gamma range (n = 43), which may underlie the gamma band firing properties of these neurons. The subthreshold oscillations were blocked by the sodium channel blockers tetrodotoxin (TTX, n = 21) extracellularly and N-(2,6-dimethylphenylcarbamoylmethyl)triethylammonium bromide (QX-314) intracellularly (n = 5), indicating they were sodium channel dependent. Gamma frequency subthreshold oscillations were observed in response to the nonspecific cholinergic receptor agonist carbachol (CAR, n = 11, d = 1.08) and the glutamate receptor agonists N-methyl-d-aspartic acid (NMDA, n = 12, d = 1.09) and kainic acid (KA, n = 13, d = 0.96), indicating that cholinergic and glutamatergic inputs may be involved in the activation of these subthreshold currents. Gamma band activity also was observed in population responses following application of CAR (n = 4, P < 0.05), NMDA (n = 4, P < 0.05) and KA (n = 4, P < 0.05). Voltage-sensitive, sodium channel-dependent gamma band activity appears to be a part of the intrinsic membrane properties of SubCD neurons.


Figures

Fig. 1.
Fig. 1.
Gamma band activity in whole cell recorded dorsal subcoeruleus nucleus (SubCD) neurons. A: maximal action potential (AP) frequency was measured using current steps (each step was 500 ms in duration with an increase of 30 pA per step and a 2.5-s latency between steps). Cells were divided into two cells types distinguished by their initial AP frequency during the highest amplitude current step (270 pA). The first type (circles) fired at high frequency (>80 Hz), whereas the second type (squares) fired at lower frequency (35–80 Hz) during the initiation of the response. B: records were truncated and spliced together to show only three current steps for both the high (left) and low (right) frequency cell types. The 270 pA current step is underlined and expanded in the lower records to show instantaneous changes in AP frequency. C: average of the first, middle, and end intersike intervals (ISIs) (converted to frequency) of the neurons classified in the high (left) and the low (right) frequency cell types. The black line shows the average instantaneous firing frequency during the entire current step (***P < 0.001, **P < 0.01, *P < 0.05 compared with baseline).
Fig. 2.
Fig. 2.
Sodium-dependent subthreshold oscillations in SubCD neurons. A: subthreshold oscillations were observed at membrane potentials below AP threshold (bottom, −48 mV), between APs at membrane potentials above AP threshold (middle, −43 mV), and after inactivation of sodium channels underlying APs (top, −40 mV). The dotted boxes include 1 s of recordings (top records) that are also shown at higher resolution (bottom records), revealing gamma frequency oscillations at −48 mV (bottom, red), −43 mV (middle, green), and −40 mV (top, blue). B: a power spectrum of the oscillations confirmed that some of the subthreshold oscillations at −48 mV (red), −43 mV (green), and −40 mV (blue) were in the alpha and gamma frequency ranges but no higher. C: low concentration of tetrodotoxin (TTX, 0.01 μM, top) blocked sodium channels responsible for AP generation, but subthreshold oscillations were still observed, which were then blocked by high concentration of TTX (10 μM, bottom). The dotted boxes include 1 s of recordings (top records) that are also shown at higher resolution (bottom records) during 0.01 μM TTX (top, orange) and 10 μM TTX (bottom, brown). D: addition of QX-314 (5 mM) to the intracellular solution also blocked the subthreshold oscillations (dotted black boxes). E: power spectra of the recordings shown in C (left) and D (right). Before TTX (green), peaks were observed in the power spectrum, which were partially blocked by 0.01 μM TTX (orange) and almost completely blocked by 10 μM TTX (brown). QX-314 (5 mM; black) also blocked the subthreshold oscillations.
Fig. 3.
Fig. 3.
Gamma frequency subthreshold oscillations in SubCD neurons induced by cholinergic and glutamatergic inputs. A: recording of a SubCD neuron before application of 4 μM N-methyl-d-aspartic acid (NMDA; −60 mV), and during the peak response to NMDA (−43 mV). The green dotted boxes include 1-s recordings (top record, higher resolution below) revealing gamma frequency oscillations during superfusion of NMDA. The power spectrum (right) of the subthreshold oscillations revealed peaks at alpha and gamma band, with a high amplitude peak at 28 Hz during NMDA exposure (green), compared with control (black). B: kainic acid (KA; 1 μM) also depolarized the membrane to −43 mV and subthreshold oscillations were observed. The purple dotted boxes include 1-s recordings (top record, higher resolution below), revealing gamma frequency oscillations during the response to KA. The power spectrum (right) of the subthreshold oscillations revealed peaks at 14 Hz and 21 Hz during KA exposure (purple) compared with control (black). C: subthreshold oscillations were observed after superfusion with CAR (30 μM). The red dotted boxes include a 1-s recording (top record, higher resolution below), revealing alpha and gamma frequency oscillations during CAR exposure. The power spectrum (right) of the subthreshold oscillations following CAR (red) showed peaks at 15, 23 and 34 Hz, compared with control (black).
Fig. 4.
Fig. 4.
Population response recordings revealed gamma frequency activity. A: one second records before (top, black), during (middle, green), and after washout (bottom, black) of NMDA (10 μM). B: power spectrum of the 20-s recordings, including the 1-s shown in A, revealed an overall increase in activity as well as specific peaks in the alpha and gamma ranges during NMDA exposure (green) compared with control (black). C: a graph of ERSPs was generated using 9 min of recordings during NMDA exposure and 2 min washout. NMDA took effect at minute 3, and the peak effect was observed between minutes 5 and 9. D: 1-s sample records before (top, black), during (middle, purple), and after washout (bottom, black) of KA (2 μM). E: power spectrum of 20-s recordings, including the 1 s shown in D, revealed specific peaks in the alpha and gamma ranges during KA exposure (purple) compared with control (black). F: graph of event-related spectral perturbations (ERSPs) was generated using 9 min of recordings taken during a 10-min KA exposure and 5 min after exposure. The effect of KA began at minute 2, gradually increasing activity with a peak effect after 4 min. G: 1-s sample records before (top, black), during (middle, red), and after washout (bottom, black) of CAR (50 μM). H: power spectrum of 20-s recordings, including the 1 s shown in G, revealed peaks of activity in the alpha, low gamma, and mid gamma range during CAR exposure (red) compared with control (black). I: graph of ERSPs was generated using 10 min of recordings during CAR exposure. The effect of CAR started at minute 3, with a peak effect after 5 min.

Similar articles

Cited by

  • Visualization of fast calcium oscillations in the parafascicular nucleus.
    Hyde J, Kezunovic N, Urbano FJ, Garcia-Rill E. Hyde J, et al. Pflugers Arch. 2013 Sep;465(9):1327-40. doi: 10.1007/s00424-013-1264-6. Epub 2013 Apr 16. Pflugers Arch. 2013. PMID: 23588378 Free PMC article.
  • Arousal and drug abuse.
    Urbano FJ, Bisagno V, Garcia-Rill E. Urbano FJ, et al. Behav Brain Res. 2017 Aug 30;333:276-281. doi: 10.1016/j.bbr.2017.07.013. Epub 2017 Jul 17. Behav Brain Res. 2017. PMID: 28729115 Free PMC article. Review.
  • Pedunculopontine Gamma Band Activity and Development.
    Garcia-Rill E, Luster B, Mahaffey S, MacNicol M, Hyde JR, D'Onofrio SM, Phillips C. Garcia-Rill E, et al. Brain Sci. 2015 Dec 3;5(4):546-67. doi: 10.3390/brainsci5040546. Brain Sci. 2015. PMID: 26633526 Free PMC article. Review.
  • Gamma band activity in the reticular activating system.
    Urbano FJ, Kezunovic N, Hyde J, Simon C, Beck P, Garcia-Rill E. Urbano FJ, et al. Front Neurol. 2012 Jan 31;3:6. doi: 10.3389/fneur.2012.00006. eCollection 2012. Front Neurol. 2012. PMID: 22319508 Free PMC article.
  • Gamma band activity in the RAS-intracellular mechanisms.
    Garcia-Rill E, Kezunovic N, D'Onofrio S, Luster B, Hyde J, Bisagno V, Urbano FJ. Garcia-Rill E, et al. Exp Brain Res. 2014 May;232(5):1509-22. doi: 10.1007/s00221-013-3794-8. Epub 2013 Dec 6. Exp Brain Res. 2014. PMID: 24309750 Free PMC article. Review.

References

    1. Azouz R, Gray CM, Nowak LG, McCormick DA. Physiological properties of inhibitory interneurons in cat striate cortex. Cereb Cortex 7:534–545,1997 - PubMed
    1. Baghdoyan HA, Rodrigo-Angulo ML, McCarley RW, Hobson JA. A neuroanatomical gradient in the pontine tegmentum for the cholinoceptive induction of desynchronized sleep signs. Brain Res 414:245–261,1987 - PubMed
    1. Baghdoyan HA, Rodrigo-Angulo ML, McCarley RW, Hobson JA. Site-specific enhancement and suppression of desynchronized sleep signs following cholinergic stimulation of three brainstem regions. Brain Res 306:39–52,1984 - PubMed
    1. Barraza D, Kita H, Wilson CJ. Slow spike frequency adaptation in neurons of the rat subthalamic nucleus. J Neurophysiol 102:3689–3697,2009 - PMC - PubMed
    1. Boissard R, Gervasoni D, Schmidt MH, Barbagli B, Fort P, Luppi PH. The rat ponto-medullary network responsible for paradoxical sleep onset and maintenance: a combined microinjection and functional neuroanatomical study. Eur J Neurosci 16:1959–1973,2002 - PubMed

Publication types

MeSH terms

LinkOut - more resources