

Pi sampling: a methodical and flexible approach to initial macromolecular crystallization screening
- PMID: 21543849
- PMCID: PMC3087625
- DOI: 10.1107/S0907444911008754
Pi sampling: a methodical and flexible approach to initial macromolecular crystallization screening
Abstract
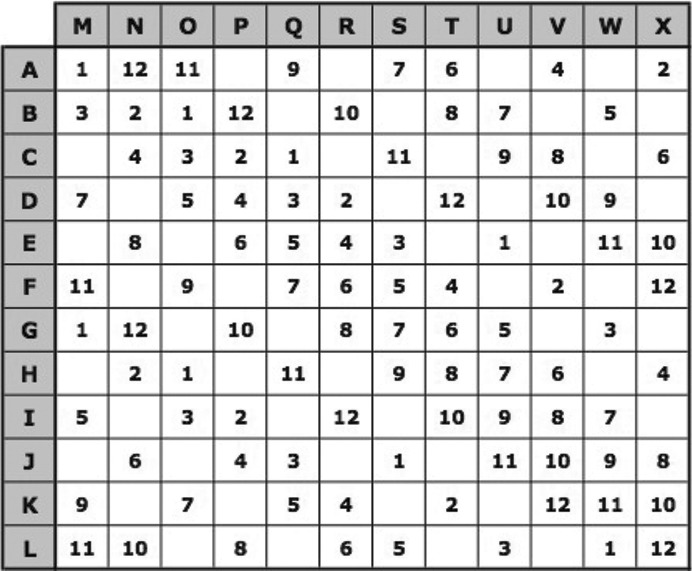
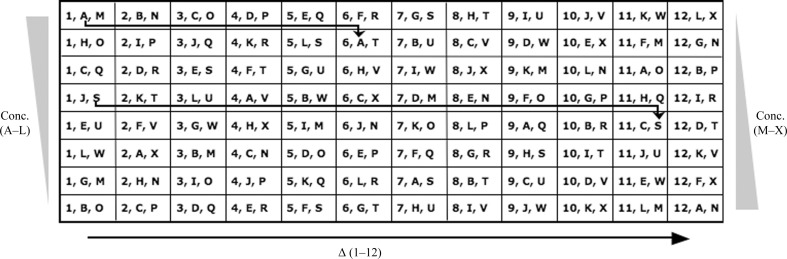
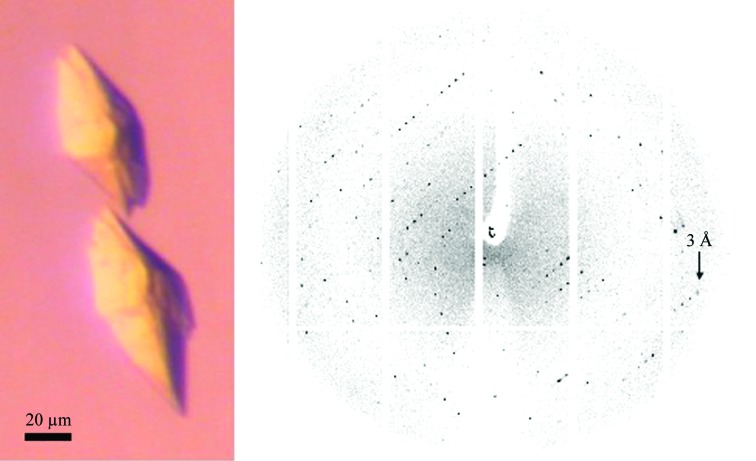
The Pi sampling method is derived from the incomplete factorial approach to macromolecular crystallization screen design. The resulting `Pi screens' have a modular distribution of a given set of up to 36 stock solutions. Maximally diverse conditions can be produced by taking into account the properties of the chemicals used in the formulation and the concentrations of the corresponding solutions. The Pi sampling method has been implemented in a web-based application that generates screen formulations and recipes. It is particularly adapted to screens consisting of 96 different conditions. The flexibility and efficiency of Pi sampling is demonstrated by the crystallization of soluble proteins and of an integral membrane-protein sample.
Figures
References
-
- Bergfors, T. (2007). Methods Mol. Biol. 363, 131–151. - PubMed
-
- Brzozowski, A. M. & Walton, J. (2001). J. Appl. Cryst. 34, 97–101.
-
- Carter, C. W. & Carter, C. W. (1979). J. Biol. Chem. 254, 12219–12223. - PubMed
-
- Clarke, O. B., Caputo, A. T., Hill, A. P., Vandenberg, J. I., Smith, B. J. & Gulbis, J. M. (2010). Cell, 141, 1018–1029. - PubMed
MeSH terms
Substances
Grants and funding
LinkOut - more resources
Full Text Sources
Other Literature Sources
Research Materials
Miscellaneous
