Superoxide reductase from Nanoarchaeum equitans: expression, purification, crystallization and preliminary X-ray crystallographic analysis
- PMID: 21543869
- PMCID: PMC3087648
- DOI: 10.1107/S1744309111009432
Superoxide reductase from Nanoarchaeum equitans: expression, purification, crystallization and preliminary X-ray crystallographic analysis
Abstract
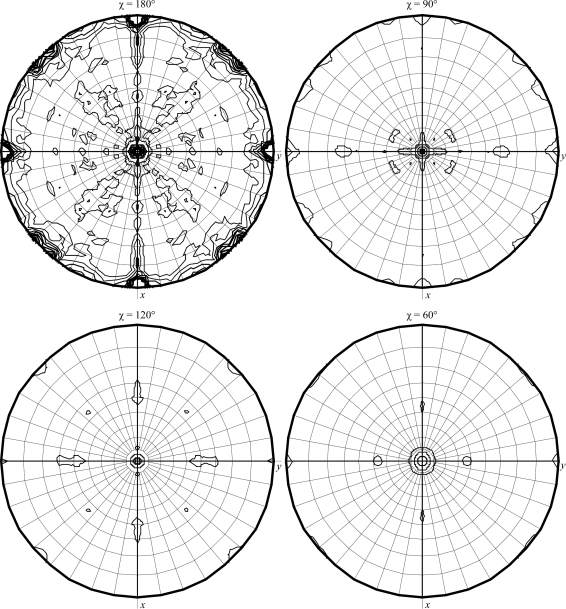
Superoxide reductases (SORs) are the most recent oxygen-detoxification system to be identified in anaerobic and microaerobic bacteria and archaea. SORs are metalloproteins that are characterized by their possession of a catalytic nonhaem iron centre in the ferrous form coordinated by four histidine ligands and one cysteine ligand. Ignicoccus hospitalis, a hyperthermophilic crenarchaeon, is the only organism known to date to serve as a host for Nanoarchaeum equitans, a nanosized hyperthermophilic archaeon isolated from a submarine hot vent which completely depends on the presence of and contact with I. hospitalis cells for growth to occur. Similarly to I. hospitalis, N. equitans has a neelaredoxin (a 1Fe-type SOR) that keeps toxic oxygen species under control, catalysing the one-electron reduction of superoxide to hydrogen peroxide. Blue crystals of recombinant N. equitans SOR in the oxidized form (12.7 kDa, 109 residues) were obtained using polyethylene glycol (PEG 2000 MME) as precipitant. These crystals diffracted to 1.9 Å resolution at 100 K and belonged to the orthorhombic space group P2(1)2(1)2(1), with unit-cell parameters a = 51.88, b = 82.01, c = 91.30 Å. Cell-content analysis suggested the presence of four monomers in the asymmetric unit. The Matthews coefficient (V(M)) was determined to be 1.9 Å(3) Da(-1), corresponding to an estimated solvent content of 36%. Self-rotation function and native Patterson calculations suggested a tetramer with 222 point-group symmetry, similar to other 1Fe-SORs. The three-dimensional structure will be determined by the molecular-replacement method.
Figures


References
-
- Archer, M., Huber, R., Tavares, P., Moura, I., Moura, J. J., Carrondo, M. A., Sieker, L. C., LeGall, J. & Romão, M. J. (1995). J. Mol. Biol. 251, 690–702. - PubMed
-
- Ausubel, F. M., Brent, R., Kingston, R. E., Moore, D. D., Seidman, J. G., Smith, J. A. & Struhl, K. (1987). Editors. Current Protocols in Molecular Biology. New York: Greene Publishing Associates/Wiley Interscience.
-
- Berthomieu, C., Dupeyrat, F., Fontecave, M., Verméglio, A. & Nivière, V. (2002). Biochemistry, 41, 10360–10368. - PubMed
-
- Diederichs, K. & Karplus, P. A. (1997). Nature Struct. Biol. 4, 269–275. - PubMed
-
- Emerson, J. P., Coulter, E. D., Cabelli, D. E., Phillips, R. S. & Kurtz, D. M. (2002). Biochemistry, 41, 4348–4357. - PubMed
Publication types
MeSH terms
Substances
LinkOut - more resources
Full Text Sources
Miscellaneous