

Medicare part D and changes in prescription drug use and cost burden: national estimates for the Medicare population, 2000 to 2007
- PMID: 21544002
- PMCID: PMC3151472
- DOI: 10.1097/MLR.0b013e3182162afb
Medicare part D and changes in prescription drug use and cost burden: national estimates for the Medicare population, 2000 to 2007
Abstract
Context: The full effect of Medicare Part D, after the initial policy transition period and across the United States Medicare population, remains unclear.
Objective: To estimate nationally representative changes in prescription drug use and out-of-pocket drug costs 2 years after implementation of Part D.
Design, setting, and participants: We examined study outcomes over 8 years (2000 to 2007) and estimated changes after Part D, accounting for earlier trends. Our analyses used the community-dwelling sample of the Medicare Current Beneficiary Survey (unweighted unique n=38,798). Actual post-Part D outcomes were compared with projected values using 2000 to 2005 data. Subgroup analyses and standardization weights were used to address population-level shifts over time in health status and demographic characteristics.
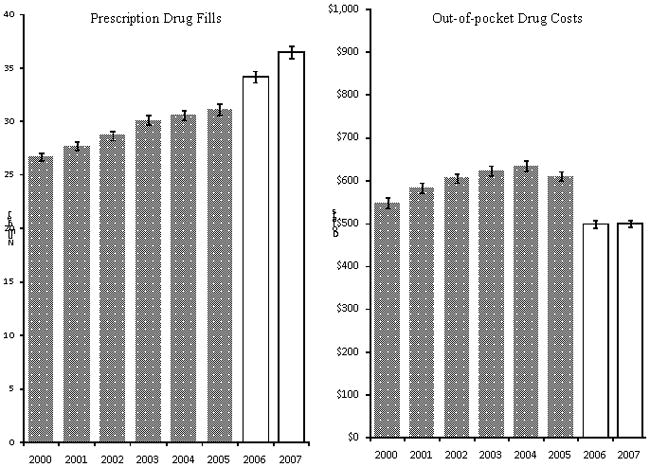
Main outcome measures: Annual prescription drug fills and out-of-pocket drug costs.
Results: We observed significant average per person increases of 1.8 prescription fills [95% confidence interval (CI), 1.1-2.5] in 2006 and 3.4 prescription fills (95% CI, 2.7-4.1) in 2007 above pre-Part D increases of 0.9 prescription fills per year. Average out-of-pocket drug costs decreased significantly by $143 (95% CI, -182.5--103.1) in 2006 and $148 (95% CI, -181.2--114.1) in 2007 above average pre-Part D increases of $12 per year. Prescription fills did not change for beneficiaries with fair to poor health until 2007 when large increases occurred (increases of 3.7 to 11.0 fills above pre-Part D trends). Significant reductions in OOP drug costs occurred in 2006 and persisted into 2007 across all groups except for sick and poor beneficiaries without Medicaid.
Conclusions: After the transition year of 2006, the impact of Part D seemed larger and more consistent across the Medicare population. Of note, sick and poor beneficiaries experienced significant improvements in prescription drug use in 2007.
Figures


References
-
- Hoadley J, Cubanski J, Hargrave E, et al. Medicare Part D Spotlight. Menlo Park, CA: The Henry J. Kaiser Family Foundation; 2010. Part D Plan Availability in 2011 and Key Changes Since 2011.
-
- Levy H, Weir D. NBER Working Papers. Cambridge, MA: National Bureau of Economic Research; 2009. Take-Up of Medicare Part D: Results from the Health and Retirement Study.
-
- Millett C, Everett CJ, Matheson EM, et al. Impact of Medicare Part D on seniors’ out-of-pocket expenditures on medications. Arch Intern Med. 2010;170:1325–1330. - PubMed
Publication types
MeSH terms
Grants and funding
LinkOut - more resources
Full Text Sources
Medical
