. 2011 Apr 22;6(4):e19277.
doi: 10.1371/journal.pone.0019277.

Sensitive dual color in vivo bioluminescence imaging using a new red codon optimized firefly luciferase and a green click beetle luciferase

Affiliations

Sensitive dual color in vivo bioluminescence imaging using a new red codon optimized firefly luciferase and a green click beetle luciferase

Laura Mezzanotte et al. PLoS One. .

Abstract

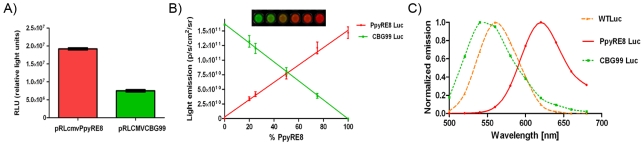
Background: Despite a plethora of bioluminescent reporter genes being cloned and used for cell assays and molecular imaging purposes, the simultaneous monitoring of multiple events in small animals is still challenging. This is partly attributable to the lack of optimization of cell reporter gene expression as well as too much spectral overlap of the color-coupled reporter genes. A new red emitting codon-optimized luciferase reporter gene mutant of Photinus pyralis, Ppy RE8, has been developed and used in combination with the green click beetle luciferase, CBG99.

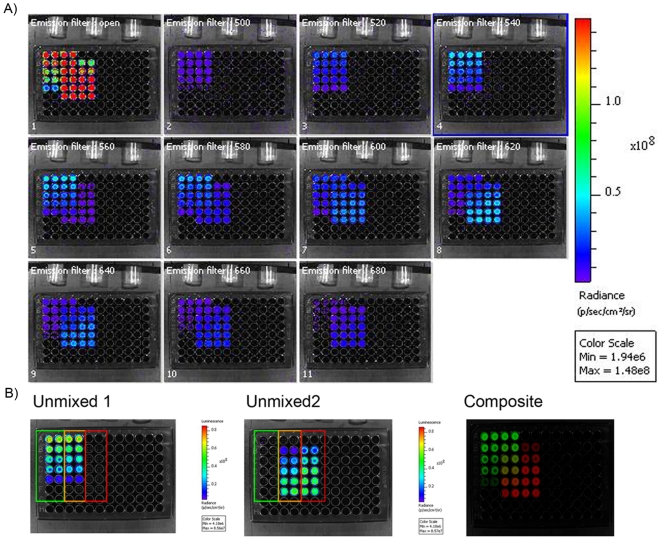
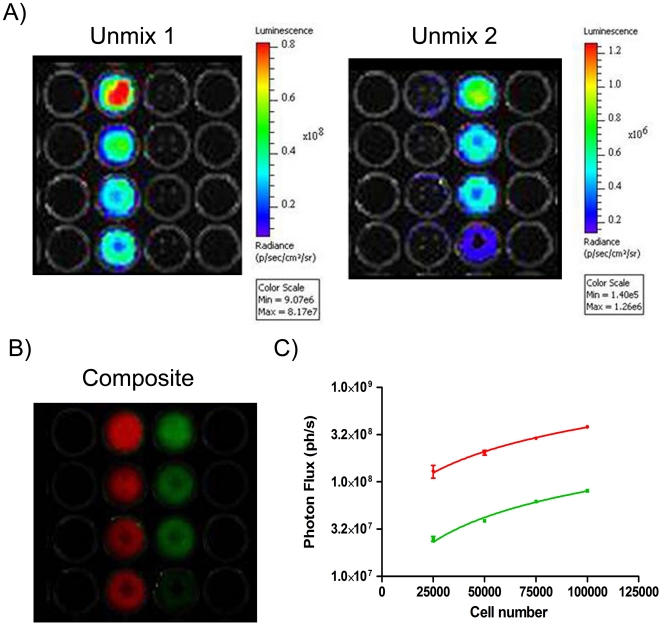
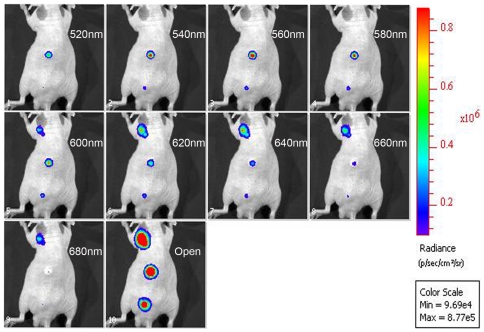
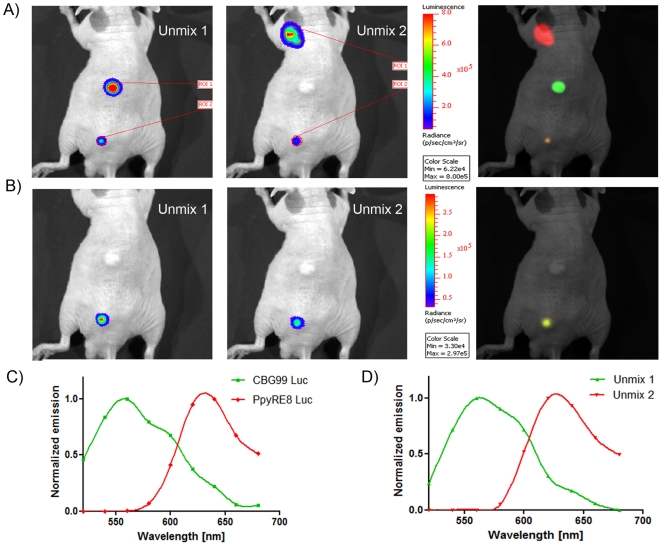
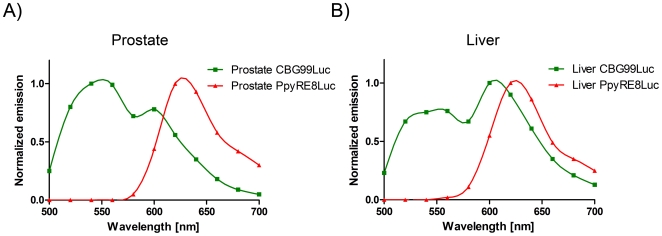
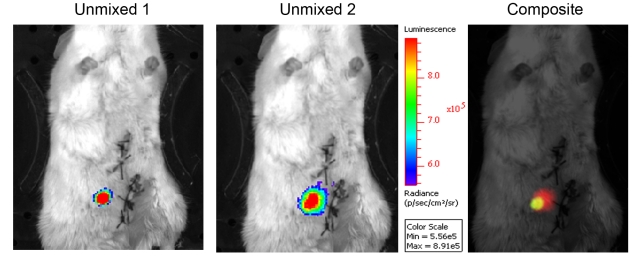
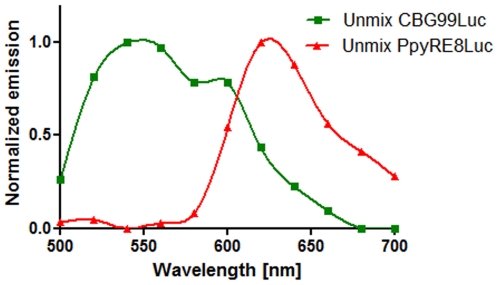
Principal findings: Human embryonic kidney cells (HEK293) were transfected with vectors that expressed red Ppy RE8 and green CBG99 luciferases. Populations of red and green emitting cells were mixed in different ratios. After addition of the shared single substrate, D-luciferin, bioluminescent (BL) signals were imaged with an ultrasensitive cooled CCD camera using a series of band pass filters (20 nm). Spectral unmixing algorithms were applied to the images where good separation of signals was observed. Furthermore, HEK293 cells that expressed the two luciferases were injected at different depth in the animals. Spectrally-separate images and quantification of the dual BL signals in a mixed population of cells was achieved when cells were either injected subcutaneously or directly into the prostate.

Significance: We report here the re-engineering of different luciferase genes for in vitro and in vivo dual color imaging applications to address the technical issues of using dual luciferases for imaging. In respect to previously used dual assays, our study demonstrated enhanced sensitivity combined with spatially separate BL spectral emissions using a suitable spectral unmixing algorithm. This new D-luciferin-dependent reporter gene couplet opens up the possibility in the future for more accurate quantitative gene expression studies in vivo by simultaneously monitoring two events in real time.


Conflict of interest statement

Competing Interests: The authors have declared that no competing interests exist.

Figures

Figure 1
Figure 1. Validation of Ppy RE8 and CBG99 as a bioluminescent couple for multicolor imaging.
(A) Level of expression of lentiviral constructs in HEK293 cells. (B) Spectral unmixing of cell lysates mixed in different proportions. Cells were lysed 24 h after transfection with lentiviral constructs. (C) Emission spectra of luciferases calculated with Living Image software in cell lysates at 25°C with the Ppy RE8 peak around 620 nm, CBG99 around 540 nm and WT Luc around 560 nm.
Figure 2
Figure 2. Representative image of emission spectral unmixing of bioluminescence in cell lysates.
(A) Multispectral acquisition of red and green emitting cell lysates. In the left part (row 1 and 2) of the plate dilutions of green emitting lysates were dispensed in duplicate while in the right part (row 5 and 6) dilutions of the red ones. In the middle (row 3 and 4) lysates were mixed in different proportions. The plate was scanned with an open filter and at different wavelengths ranging from 500 nm to 680 nm with a 20 nm interval.(B) Resulting unmixed images used for calculation and composite of the two different luciferases in false colors.
Figure 3
Figure 3. Live cell imaging.
(A) Representative spectral unmixing of signals emitted from stable red and green HepG2 cells;105, 7.5×10⁴, 5×10⁴ and 2.5×10⁴ cells were plated for each HepG2 cell line. (B) Composite images generated after unmixing signals. (C) Graph representing the correlation between luminescent signals and different amounts of red or green luciferase expressing HepG2 cells.
Figure 4
Figure 4. Multispectral acquisition of light from live animal.
Cells expressing Ppy RE8 and CBG99 luciferases and a mixture were inoculated in the upper part, middle part and lower part of the back, respectively.
Figure 5
Figure 5. Spectral unmixing of signals after subcutaneous injection of cells.
(A) Unmixed and composite images. The injected cells were 105 (upper and middle part) and 2.5×10⁴ in the mixture (lower part). The numbers of cells calculated with Living Image software were 2.0±0.4×10⁴ for CBG99 and 2.4±0.2×10⁴ for Ppy RE8. B) Unmixed and composite image generated from the ROI of the mixture. C) Emission reference spectra of luciferases calculated from the in vivo experiments. CBG99 spectrum is represented with a green line while Ppy RE8 spectrum is represented with a red line. A slight red shift was noticed for both luciferases. D) Unmixed spectra calculated for the region of interest of the mixture. The spectra are almost identical to the reference ones.
Figure 6
Figure 6. Reference spectra calculated after injection of red or green emitting cells in the prostate (A) and in the liver (B).
CBG99 spectrum is represented with a green line while Ppy RE8 spectrum is represented with red line.
Figure 7
Figure 7. Representative unmixing images generated after injecting a mixture of red and green cells in the prostate.
Figure 8
Figure 8. Unmixed spectra calculated for the region of interest of the mixture.
CBG99 spectrum is represented with a green line while Ppy RE8 spectrum is represented with red line.

References

    1. Kaijzel EL, van der Pluijm G, Löwik CW. Whole-body optical imaging in animal models to assess cancer development and progression. Clin Cancer Res. 2007;13:3490–7. - PubMed
    1. Contag CH, Bachmann MH. Advances in in vivo bioluminescence imaging of gene expression. Annu Rev Biomed ENG. 2002;4:235–60. - PubMed
    1. Tannous BA, Kim DE, Fernandez JL, Weissleder R, Breakefield XO. Codon-optimized Gaussia luciferase cDNA for mammalian gene expression in culture and in vivo. Mol Ther. 2005;11:435–43. - PubMed
    1. Contag CH, Contag PR, Mullins JI, Spilman SD, Stevenson DK, et al. Photonic detection of bacterial pathogens in living hosts. Mol Microbiol. 1995;18:593–603. - PubMed
    1. Close DM, Patterson SS, Ripp S, Baek SJ, Sanseverino J, et al. Autonomous bioluminescent expression of the bacterial luciferase gene cassette (lux) in a mammalian cell line. PLoS One. 2010;5:e12441. - PMC - PubMed

Publication types