. 2011 Apr 22;6(4):e19211.
doi: 10.1371/journal.pone.0019211.

Patterns of plant biomass partitioning depend on nitrogen source

Affiliations

Patterns of plant biomass partitioning depend on nitrogen source

Camila Aguetoni Cambui et al. PLoS One. .

Abstract

Nitrogen (N) availability is a strong determinant of plant biomass partitioning, but the role of different N sources in this process is unknown. Plants inhabiting low productivity ecosystems typically partition a large share of total biomass to belowground structures. In these systems, organic N may often dominate plant available N. With increasing productivity, plant biomass partitioning shifts to aboveground structures, along with a shift in available N to inorganic forms of N. We tested the hypothesis that the form of N taken up by plants is an important determinant of plant biomass partitioning by cultivating Arabidopsis thaliana on different N source mixtures. Plants grown on different N mixtures were similar in size, but those supplied with organic N displayed a significantly greater root fraction. ¹⁵N labelling suggested that, in this case, a larger share of absorbed organic N was retained in roots and split-root experiments suggested this may depend on a direct incorporation of absorbed amino acid N into roots. These results suggest the form of N acquired affects plant biomass partitioning and adds new information on the interaction between N and biomass partitioning in plants.


Conflict of interest statement

Competing Interests: The authors have declared that no competing interests exist.

Figures

Figure 1
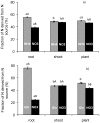
Figure 1. Biomass (a) and fraction of biomass in roots (b) of Arabidopsis thaliana grown on either NO3 or on NH4NO3 or on different combinations of glutamine and NO3 .
All media had a total N concentration of 6 mM. Plants were grown on sterile agar plates for 21 days. Bars represent average values ± SE, n = 8. Different lower-case letters indicate differences at p≤0.05 between N treatments.
Figure 2
Figure 2. Origin of root N, shoot N and plant N, in Arabidopsis thaliana plants grown on 3 mM NH4NO3 (a) or a mixture of 1.5 mM glutamine+3 mM NO3 (b).
Fractions of N derived from individual N sources in the mixtures were calculated from N contents and rates of 15N abundance in plant parts. Plants were grown on sterile agar plates for 21 days. Bars represent average values ± SE, n = 5. Different lower-case and capital letters indicate differences at p≤0.05 between plant parts and between N sources, respectively.
Figure 3
Figure 3. Split-root experiment with Arabidopsis thaliana.
Plants were grown on agar plates that were divided into two identical compartments by a plastic rib. The growth medium was identical on both sides of the rib and with N supplied as a mixture of 1.5 mM glutamine+3 mM NO3 but on one side, one of the N sources (either glutamine or NO3 ) was 15N-labelled. Bars indicate the fraction of N derived from each source and represent average ± SE, n = 6–7. Different lower-case and capital letters indicate differences at p≤0.05 between plants parts and between N sources, respectively.
Figure 4
Figure 4. Split-root experiment with Arabidopsis thaliana.
Plants were grown on agar plates that were divided into two identical compartments by a plastic rib. The two compartments contained either 1.5 mM glutamine or 3 mM NO3 as N sources. For each plate, one of the N sources (either glutamine or NO3 ) was 15N-labelled. Bars indicate the fraction of N derived from each source for the shoot and for roots growing in the NO3 compartment and the glutamine compartment. Bars represent average ± SE, n = 5. Different lower-case and capital letters indicate differences at p≤0.05 between plant parts, and between N sources, respectively.

References

    1. Marschner H. Mineral Nutrition of Higher Plants (2nd edn) Academic Press; 1995.
    1. Hodge A. Root decisions. Plant Cell Environ. 2009;32:628–640. - PubMed
    1. Brouwer R. Nutritive influences on the distribution of dry matter in the plant. Neth J Agr Sci. 1962;10:399–408.
    1. Chapin FS., III The mineral nutrition of wild plants. Ann Rev Ecol Syst. 1980;11:233–260.
    1. Levin SA, Mooney HA, Field C. The dependence of plant root∶shoot ratios on internal nitrogen concentration. Ann Bot. 1989;64:71–75.

Publication types