. 2012 Apr 15;130(8):1733-44.
doi: 10.1002/ijc.26164. Epub 2011 Aug 3.

Oncogenic KRAS-induced interleukin-8 overexpression promotes cell growth and migration and contributes to aggressive phenotypes of non-small cell lung cancer

Affiliations

Oncogenic KRAS-induced interleukin-8 overexpression promotes cell growth and migration and contributes to aggressive phenotypes of non-small cell lung cancer

Noriaki Sunaga et al. Int J Cancer. .

Abstract

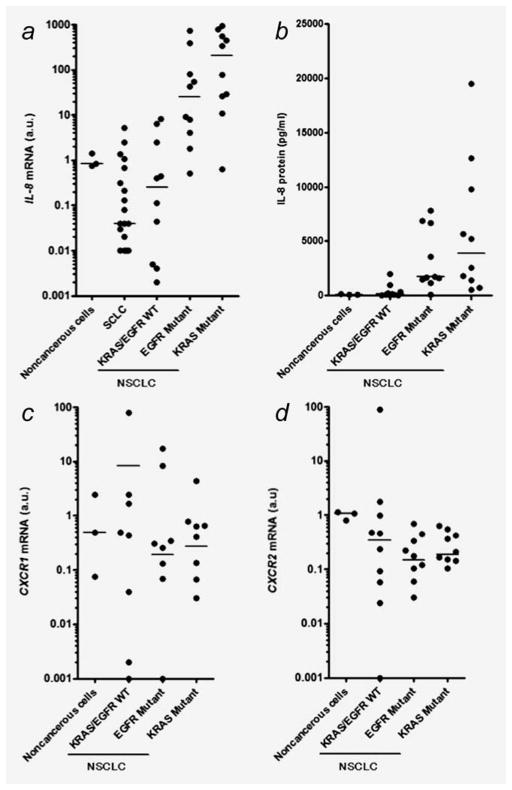
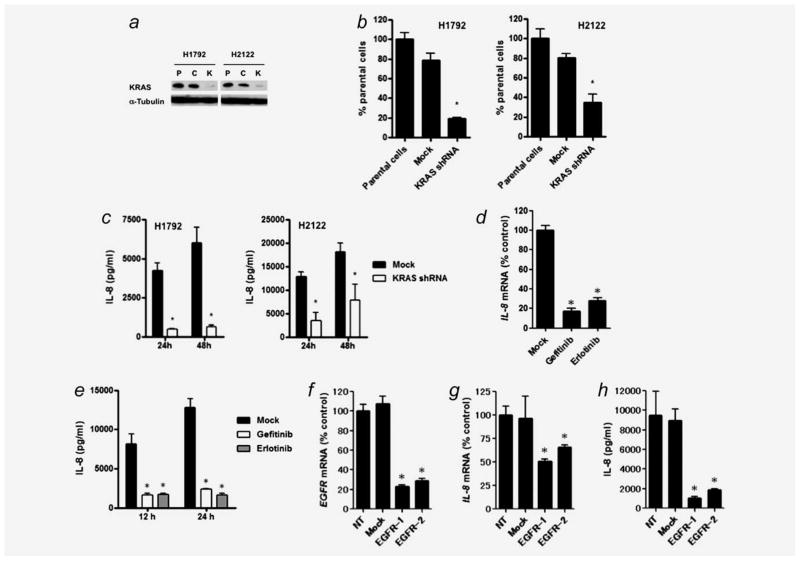
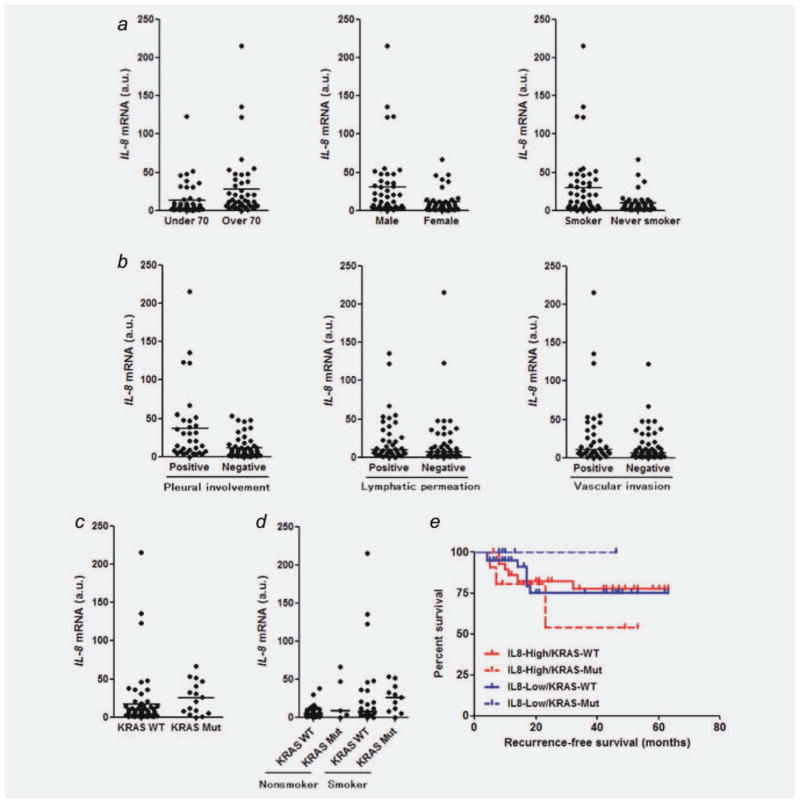
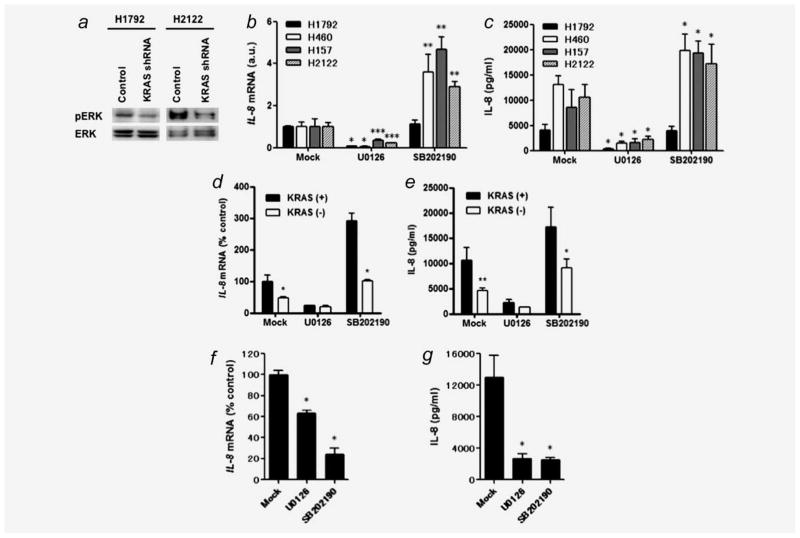
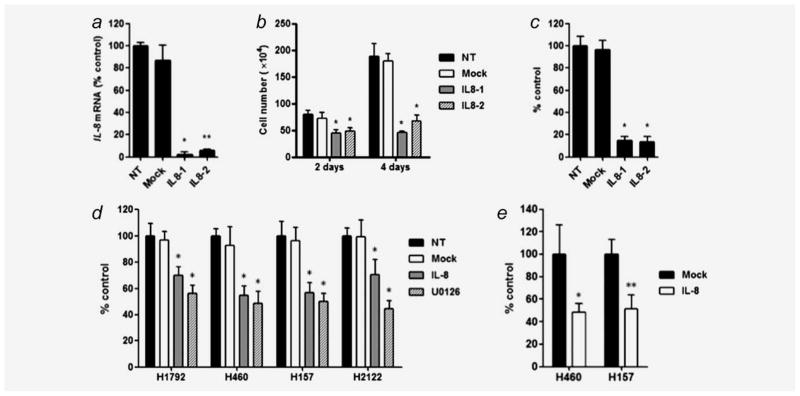
The CXC chemokine interleukin-8 (IL-8) is an angiogenic growth factor that is overexpressed in various cancers, including non-small cell lung cancer (NSCLC). Previously, IL-8 was shown as a transcriptional target of RAS signaling, raising the possibility of its role in oncogenic KRAS-driven NSCLC. Using microarray analysis, we identified IL-8 as the most downregulated gene by shRNA-mediated KRAS knockdown in NCI-H1792 NSCLC cells where IL-8 is overexpressed. NSCLC cell lines harboring KRAS or EGFR mutations overexpressed IL-8, while IL-8 levels were more prominent in KRAS mutants compared to EGFR mutants. IL-8 expression was downregulated by shRNA-mediated KRAS knockdown in KRAS mutants or by treatment with EGFR tyrosine kinase inhibitors and EGFR siRNAs in EGFR mutants. In our analysis of the relationship of IL-8 expression with clinical parameters and mutation status of KRAS or EGFR in 89 NSCLC surgical specimens, IL-8 expression was shown to be significantly higher in NSCLCs of males, smokers, and elderly patients and those with pleural involvement and KRAS mutated adenocarcinomas. In KRAS mutant cells, the MEK inhibitor markedly decreased IL-8 expression, while the p38 inhibitor increased IL-8 expression. Attenuation of IL-8 function by siRNAs or a neutralizing antibody inhibited cell proliferation and migration of KRAS mutant/IL-8 overexpressing NSCLC cells. These results indicate that activating mutations of KRAS or EGFR upregulate IL-8 expression in NSCLC; IL-8 is highly expressed in NSCLCs from males, smokers, elderly patients, NSCLCs with pleural involvement, and KRAS-mutated adenocarcinomas; and IL-8 plays a role in cell growth and migration in oncogenic KRAS-driven NSCLC.


Figures

Figure 1
Figure 1
(a) Expression of IL-8 mRNA in human bronchial epithelial cell lines (noncancerous cells; N = 3), SCLC cell lines (N = 22), NSCLC cell lines with wild-type KRAS/EGFR (KRAS/EGFR WT; N = 10), NSCLC cell lines harboring EGFR mutations (EGFR mutant; N = 10) or KRAS mutations (KRAS mutant; N = 10). IL-8 levels were significantly higher in KRAS mutant (p < 0.01) or EGFR mutant (p < 0.05) than in KRAS/EGFR WT. (b) IL-8 protein concentration in cultured lung cancer cell lines as determined by ELISA assay. Twenty-four hours after plating 106 cells on 100 mm dishes, culture medium was replaced with 10 ml of RPMI 1640 medium with 5% serum. After cells were cultured for additional 48 hr, medium was collected, and an ELISA assay was performed. IL-8 levels were significantly higher in EGFR Mutant (p < 0.05) or KRAS Mutant (p < 0.01) NSCLCs than in KRAS/EGFR WT. Expressions of (c) CXCR1 and (d) CXCR2 mRNA in the noncancerous and NSCLC cell lines. The arbitrary units (a.u.) of the expressions of IL-8, CXCR1, and CXCR2 were calculated as described in Materials and Methods. Points represent the mean IL-8 levels from three independent experiments. Lines represent the median levels in each group. Differences were analyzed by Kruskal–Wallis test with Dunn’s multiple comparisons.
Figure 2
Figure 2
(a) Stable knockdown of mutant KRAS expression by retroviral-mediated shRNA in H1792 and H2122 cells, both of which harbor the KRAS G12C mutation (GGT to TGT) in codon 12. P: parental cells, C: pRS (non-targeting shRNA) vector-infected cells, K: pRS-KRAS-C12-infected cells. Thirty micrograms of whole cell lysate was loaded per lane, and western blots were performed using α-Tubulin expression levels as a loading control. (b) shRNA-mediated KRAS knockdown reduces IL-8 mRNA expression in H1792 and H2122 cells as determined by quantitative real-time RT-PCR. *p < 0.01 for comparison between KRAS knockdown cells and the parental cells by Kruskal–Wallis test with Dunn’s multiple comparisons. Mean levels of the parental cells are set at 100%. (c) shRNA-mediated KRAS knockdown reduced IL-8 protein levels in cultured medium of H1792 and H2122 cells as determined by ELISA assay. *p < 0.001 for comparisons between KRAS knockdown cells and the parental cells by ANOVA with Bonferroni multiple comparisons. Column represents mean ± SD from four independent experiments. (d) Treatment with gefitinib or erlotinib transcription ally down-regulated IL-8 expression in HCC827 NSCLC cells harboring EGFR mutations. After treatment with gefitinib (1 μM) or erlotinib (1 μM) for 24 hr, cells were harvested for quantitative real-time RT-PCR analysis. Columns represent means ± SD from four independent experiments. *p < 0.001 for comparison of Mock treatment (DMSO alone) by ANOVA with Bonferroni multiple comparisons. (e) Treatment with gefitinib or erlotinib reduced IL-8 protein levels in cultured medium of HCC827 cells. After treatment with gefitinib (1 μM) or erlotinib (1 μM) for 12 or 24 hr, cultured medium was collected, and IL-8 concentration was determined by ELISA assay. Columns represent means ± SD from three independent experiments. *p < 0.001 for comparison of Mock treatment (DMSO alone) by ANOVA with Bonferroni multiple comparisons. (f) siRNA-mediated EGFR knockdown in HCC827 cells as evaluated by quantitative RT-PCR. NT: treatment with medium alone; Mock: treatment with Tax siRNA. Two siRNAs targeting different sites of EGFR mRNA (EGFR-1 and EGFR-2) were used. Columns represent the mean ± SD from four independent experiments. *p < 0.0001 for comparisons between NT and each siRNA treatment by ANOVA with Bonferroni multiple comparisons. shRNA-mediated EGFR knockdown reduced IL-8 expression at (g) mRNA and (h) protein levels in HCC827 cells as evaluated by quantitative real-time RT-PCR and ELISA assays. Twenty-four after siRNA transfection, the medium was replaced by fresh medium. After 48 hr, cells and supernatants were harvested for the assays. *p < 0.0001 for comparisons between NT and each siRNA treatment by ANOVA with Bonferroni multiple comparisons. Mean levels of NT are set at 100% for Fig. 2F and 2G.
Figure 3
Figure 3
(a) Comparisons of IL-8 mRNA expression levels between patients with NSCLC under the age of 70 and those over 70 years old (p = 0.0016), males and females (p = 0.0056), smokers and nonsmokers (p = 0.007); (b) NSCLC specimens with or without pleural involvement (p = 0.0003), NSCLC specimens with or without lymphatic permeation (p = 0.0871), NSCLC specimens with or without vascular invasion (p = 0.054); (c) adenocarcinoma specimens with or without KRAS mutations (p = 0.0355). IL-8 expression levels in NSCLC surgical specimens were normalized to the mean (= 1 a.u.) of values obtained from five different noncancerous lung tissues. Points represent the mean IL-8 levels obtained from three independent experiments. Lines represent median IL-8 levels in each group. Differences were analyzed by Mann–Whitney test. (d) Comparison of IL-8 mRNA expression among the four groups of KRAS wild-type/nonsmoker, KRAS mutant/nonsmoker, KRAS wild-type/smoker and KRAS mutant/smoker (the median levels of these groups were 5.9, 9.2, 8.7, and 26.3, respectively; p = 0.0279 by Kruskal–Wallis test). (e) Kaplan–Meier analysis of disease-free survival (month) for NSCLC patients who were divided according to the IL-8 expression levels and KRAS mutation status. KRAS-WT: KRAS wild-type; KRAS-Mut: KRAS mutation; IL8-High: ≤7.5 a.u.; IL8-Low: >7.5 a.u. Note that the median IL-8 level of all NSCLC tumor specimens was 7.5 a.u.
Figure 4
Figure 4
(a) shRNA-mediated KRAS knockdown reduces phosphorylated ERK levels in H1792 and H2122 cells. Thirty microgram of whole cell lysate was loaded per lane, and western blots were performed using total ERK expression levels as a loading control. (b) Effects of U0126 and SB202190 on IL-8 mRNA expression in KRAS mutant/IL-8 overexpressing NSCLC cell lines. Twenty-four hour after 5 × 10⁵ cells were plated in each well of 6-well plates, cultured medium was replaced with 2 ml of the growth medium with U0126 (10 μM) or SB202190 (10 μM). After additional culture for 24 hr, cells were harvested for real-time RT-PCR analysis. Columns represent means ± SD from four independent experiments. *p < 0.01, **p < 0.001, ***p < 0.05 for comparisons of the treatment with DMSO alone (Mock) to the treatment with U0126 or SB202190 on each cell line by ANOVA with multiple comparisons. (c) Effects of U0126 or SB202190 on IL-8 protein expression from KRAS mutant/IL-8 overexpressing NSCLC cells. After treatments with U0126 or SB202190 for 24 h, cultured medium was collected, and IL-8 concentration was determined by ELISA. Columns represent means ± SD from four independent experiments. *p < 0.001 for comparisons of the treatment with DMSO alone (Mock) to the treatment with U0126 or SB202190 on each cell line by ANOVA with Bonferroni multiple comparisons. Effects of KRAS knockdown on IL-8 expression at (d) mRNA and (e) protein levels in H2122 cells treated with U0126 or SB202190. IL-8 levels were determined at 24 hr posttreatment. Columns represent means ± SD from four independent experiments. *p < 0.001, **p < 0.01 for comparison between mutant KRAS-disrupted cells (white square) and mutant KRAS-expressing (pRS vector-infected) cells (black square) on each treatment by ANOVA with Bonferroni multiple comparisons. Effects of U0126 and SB202190 on IL-8 expression at (f) mRNA and (g) protein levels in HCC827 cells. The experimental procedures and conditions were the same as Figures 4b and 4c. *p < 0.001 for comparisons of the treatment with DMSO alone (Mock) to the treatment with U0126 or SB202190 by ANOVA with Bonferroni multiple comparisons.
Figure 5
Figure 5
(a) siRNA mediated knockdown of IL-8 expression in H1792 cells as evaluated by quantitative RT-PCR. NT: treatment with medium alone; Mock: treatment with Tax siRNA as a negative control. Two siRNAs targeting different sites of IL-8 mRNA (IL8-1 and IL8-2) were used to knockdown IL-8. Columns represent the mean ± SD from four independent experiments. *p < 0.001, **p < 0.01 for comparisons between NT and each siRNA treatment by Kruskal–Wallis test with Dunn’s multiple comparisons. siRNA-mediated IL-8 knockdown inhibited cell proliferation and colony formation as evaluated by (b) cell growth analysis using trypan-blue staining and (c) colony formation assay in H1792 cells. Columns represent the mean ± SD from six independent experiments for cell growth analysis and three independent experiments for colony formation assay. *p < 0.001 for comparison between NT and each siRNA treatment by ANOVA with Bonferroni multiple comparisons. (d) IL-8 neutralization mediated by an IL-8 antibody inhibits cell proliferation of KRAS mutant/IL-8 overexpressing NSCLC cell lines as evaluated by MTT assay. Cells were treated with medium alone (NT), IgG1 control antibody (Mock; 10 μg/ml), IL-8 antibody (IL-8; 10 μg/ml) and U0126 (10 μM) for 72 hr. *p < 0.001 for comparison between NT and each treatment by ANOVA with Bonferroni multiple comparisons. Columns represent the mean ± SD from replicates of eight from two independent experiments (e) IL-8 neutralization inhibits cell migration of H460 and H157 cells. *p < 0.01; **p < 0.05 for comparison between Mock and IL-8 antibody treatments by unpaired t-test. Columns represent means ± SD from three independent experiments.

References

    1. Downward J. Targeting RAS signalling pathways in cancer therapy. Nat Rev Cancer. 2003;3:11–22. - PubMed
    1. Sato M, Shames DS, Gazdar AF, Minna JD. A translational view of the molecular pathogenesis of lung cancer. J Thorac Oncol. 2007;2:327–343. - PubMed
    1. Buttitta F, Barassi F, Fresu G, Felicioni L, Chella A, Paolizzi D, Lattanzio G, Salvatore S, Camplese PP, Rosini S, Iarussi T, Mucilli F, et al. Mutational analysis of the HER2 gene in lung tumors from Caucasian patients: mutations are mainly present in adenocarcinomas with bronchioloalveolar features. Int J Cancer. 2006;119:2586–2591. - PubMed
    1. Mascaux C, Iannino N, Martin B, Paesmans M, Berghmans T, Dusart M, Haller A, Lothaire P, Meert AP, Noel S, Lafitte JJ, Sculier JP. The role of RAS oncogene in survival of patients with lung cancer: a systematic review of the literature with meta-analysis. Br J Cancer. 2005;92:131–139. - PMC - PubMed
    1. Isobe T, Herbst RS, Onn A. Current management of advanced non-small cell lung cancer: targeted therapy. Semin Oncol. 2005;32:315–328. - PubMed

Publication types

MeSH terms