

SNiPlay: a web-based tool for detection, management and analysis of SNPs. Application to grapevine diversity projects
- PMID: 21545712
- PMCID: PMC3102043
- DOI: 10.1186/1471-2105-12-134
SNiPlay: a web-based tool for detection, management and analysis of SNPs. Application to grapevine diversity projects
Abstract
Background: High-throughput re-sequencing, new genotyping technologies and the availability of reference genomes allow the extensive characterization of Single Nucleotide Polymorphisms (SNPs) and insertion/deletion events (indels) in many plant species. The rapidly increasing amount of re-sequencing and genotyping data generated by large-scale genetic diversity projects requires the development of integrated bioinformatics tools able to efficiently manage, analyze, and combine these genetic data with genome structure and external data.
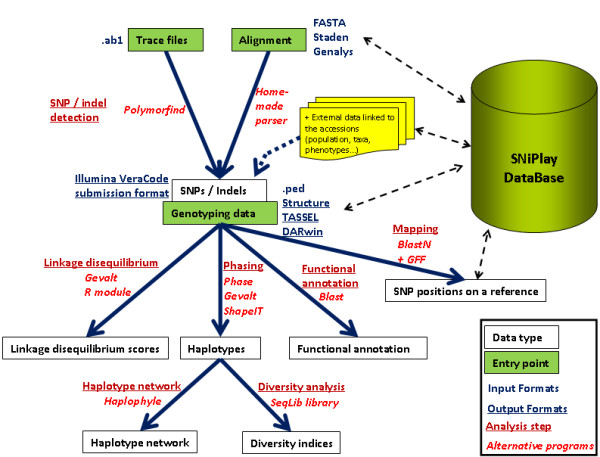
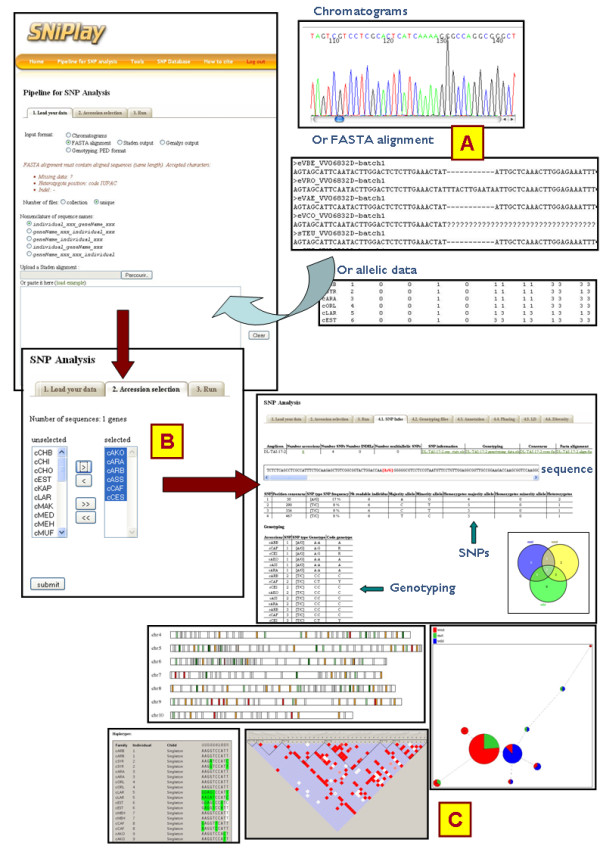
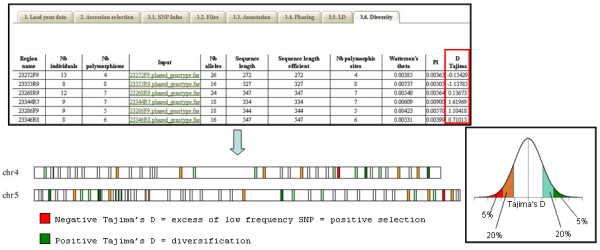
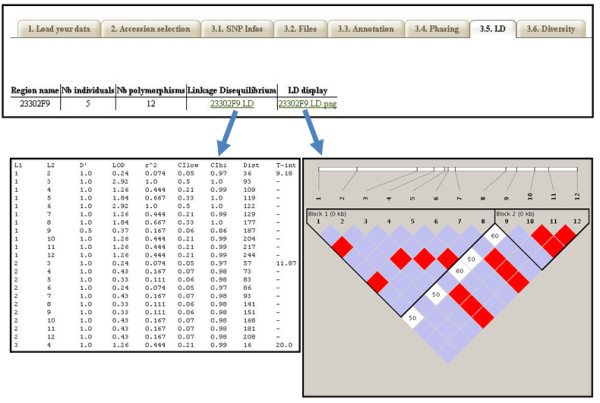
Results: In this context, we developed SNiPlay, a flexible, user-friendly and integrative web-based tool dedicated to polymorphism discovery and analysis. It integrates:1) a pipeline, freely accessible through the internet, combining existing softwares with new tools to detect SNPs and to compute different types of statistical indices and graphical layouts for SNP data. From standard sequence alignments, genotyping data or Sanger sequencing traces given as input, SNiPlay detects SNPs and indels events and outputs submission files for the design of Illumina's SNP chips. Subsequently, it sends sequences and genotyping data into a series of modules in charge of various processes: physical mapping to a reference genome, annotation (genomic position, intron/exon location, synonymous/non-synonymous substitutions), SNP frequency determination in user-defined groups, haplotype reconstruction and network, linkage disequilibrium evaluation, and diversity analysis (Pi, Watterson's Theta, Tajima's D).Furthermore, the pipeline allows the use of external data (such as phenotype, geographic origin, taxa, stratification) to define groups and compare statistical indices.2) a database storing polymorphisms, genotyping data and grapevine sequences released by public and private projects. It allows the user to retrieve SNPs using various filters (such as genomic position, missing data, polymorphism type, allele frequency), to compare SNP patterns between populations, and to export genotyping data or sequences in various formats.
Conclusions: Our experiments on grapevine genetic projects showed that SNiPlay allows geneticists to rapidly obtain advanced results in several key research areas of plant genetic diversity. Both the management and treatment of large amounts of SNP data are rendered considerably easier for end-users through automation and integration. Current developments are taking into account new advances in high-throughput technologies.SNiPlay is available at: http://sniplay.cirad.fr/.
Figures


Similar articles
-
SNiPlay3: a web-based application for exploration and large scale analyses of genomic variations.Nucleic Acids Res. 2015 Jul 1;43(W1):W295-300. doi: 10.1093/nar/gkv351. Epub 2015 Jun 3. Nucleic Acids Res. 2015. PMID: 26040700 Free PMC article.
-
High throughput SNP discovery and genotyping in grapevine (Vitis vinifera L.) by combining a re-sequencing approach and SNPlex technology.BMC Genomics. 2007 Nov 19;8:424. doi: 10.1186/1471-2164-8-424. BMC Genomics. 2007. PMID: 18021442 Free PMC article.
-
PoPoolation DB: a user-friendly web-based database for the retrieval of natural polymorphisms in Drosophila.BMC Genet. 2011 Mar 2;12:27. doi: 10.1186/1471-2156-12-27. BMC Genet. 2011. PMID: 21366916 Free PMC article.
-
Designing Allele-Specific Competitive-Extension PCR-Based Assays for High-Throughput Genotyping and Gene Characterization.Front Mol Biosci. 2022 Mar 1;9:773956. doi: 10.3389/fmolb.2022.773956. eCollection 2022. Front Mol Biosci. 2022. PMID: 35300118 Free PMC article. Review.
-
Discovery and verification of functional single nucleotide polymorphisms in regulatory genomic regions: current and developing technologies.Mutat Res. 2008 Jul-Aug;659(1-2):147-57. doi: 10.1016/j.mrrev.2008.05.001. Epub 2008 May 4. Mutat Res. 2008. PMID: 18565787 Free PMC article. Review.
Cited by
-
A multilocus sequence typing scheme of Pseudomonas putida for clinical and environmental isolates.Sci Rep. 2019 Sep 27;9(1):13980. doi: 10.1038/s41598-019-50299-6. Sci Rep. 2019. PMID: 31562354 Free PMC article.
-
Genetic diversity, linkage disequilibrium and power of a large grapevine (Vitis vinifera L) diversity panel newly designed for association studies.BMC Plant Biol. 2016 Mar 22;16:74. doi: 10.1186/s12870-016-0754-z. BMC Plant Biol. 2016. PMID: 27005772 Free PMC article.
-
Exploring the implications of INDELs in neuropsychiatric genetics: challenges and perspectives.J Mol Neurosci. 2012 Jul;47(3):419-24. doi: 10.1007/s12031-012-9714-8. Epub 2012 Feb 16. J Mol Neurosci. 2012. PMID: 22350990
-
Comparative Genomics for the Elucidation of Multidrug Resistance in Candida lusitaniae.mBio. 2019 Dec 24;10(6):e02512-19. doi: 10.1128/mBio.02512-19. mBio. 2019. PMID: 31874914 Free PMC article.
-
Roadmap to the study of gene and protein phylogeny and evolution-A practical guide.PLoS One. 2023 Feb 24;18(2):e0279597. doi: 10.1371/journal.pone.0279597. eCollection 2023. PLoS One. 2023. PMID: 36827278 Free PMC article.
References
Publication types
MeSH terms
LinkOut - more resources
Full Text Sources
Other Literature Sources
Research Materials
Miscellaneous
