. 2011 Jul 1;51(1):160-70.
doi: 10.1016/j.freeradbiomed.2011.04.007. Epub 2011 Apr 13.

Removal of H₂O₂ and generation of superoxide radical: role of cytochrome c and NADH

Affiliations

Removal of H₂O₂ and generation of superoxide radical: role of cytochrome c and NADH

Murugesan Velayutham et al. Free Radic Biol Med. .

Abstract

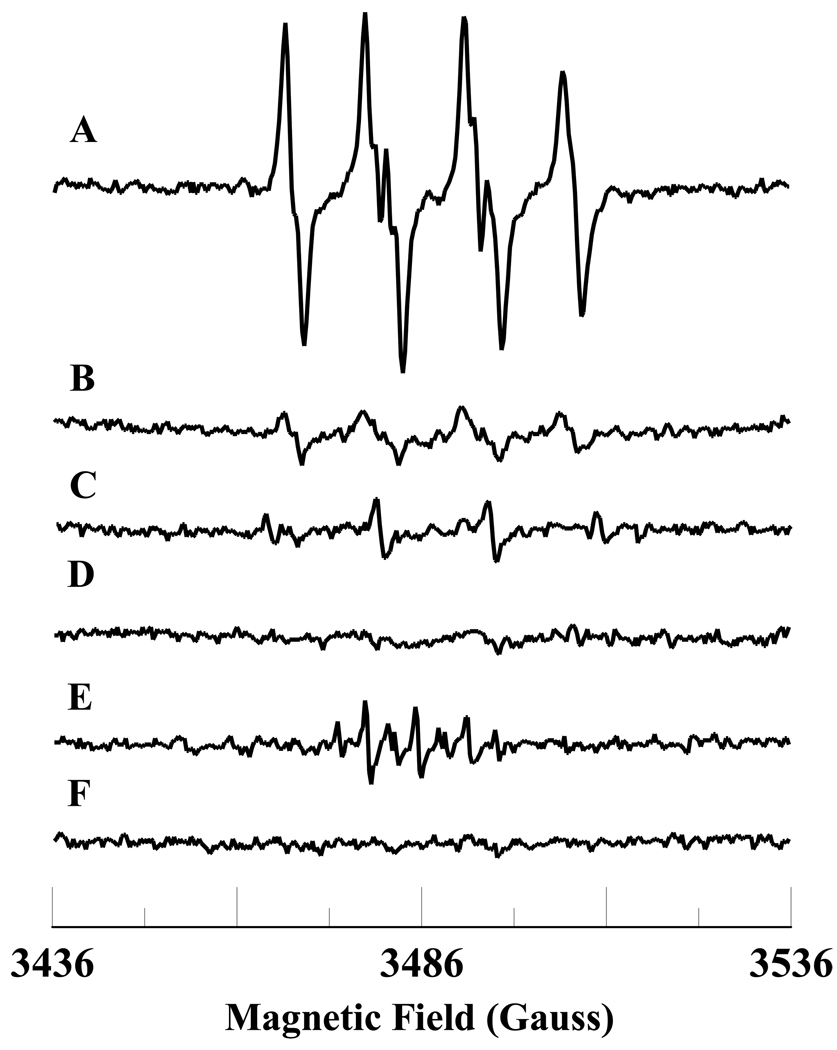
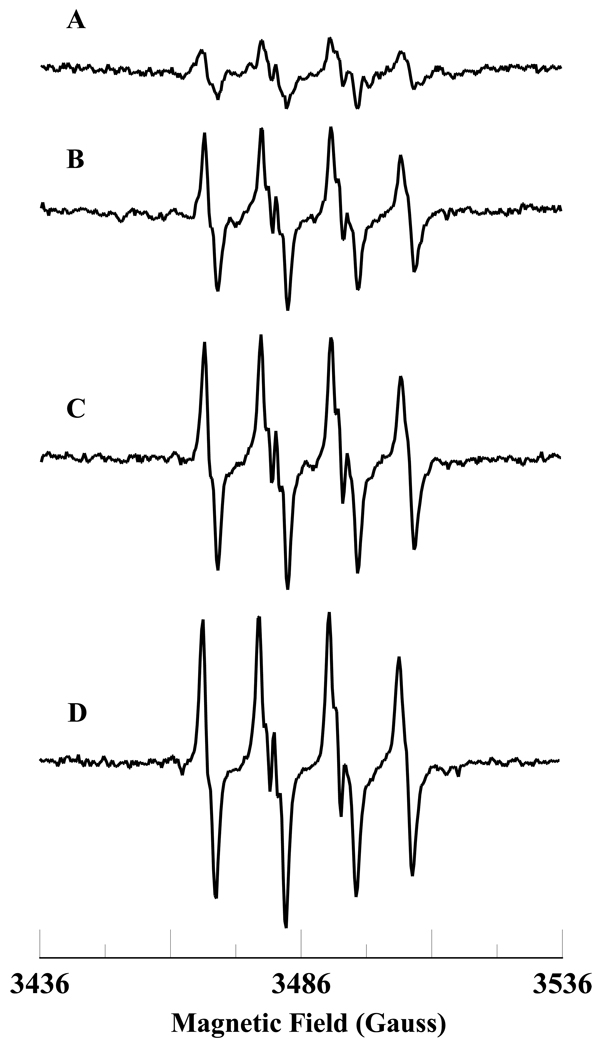
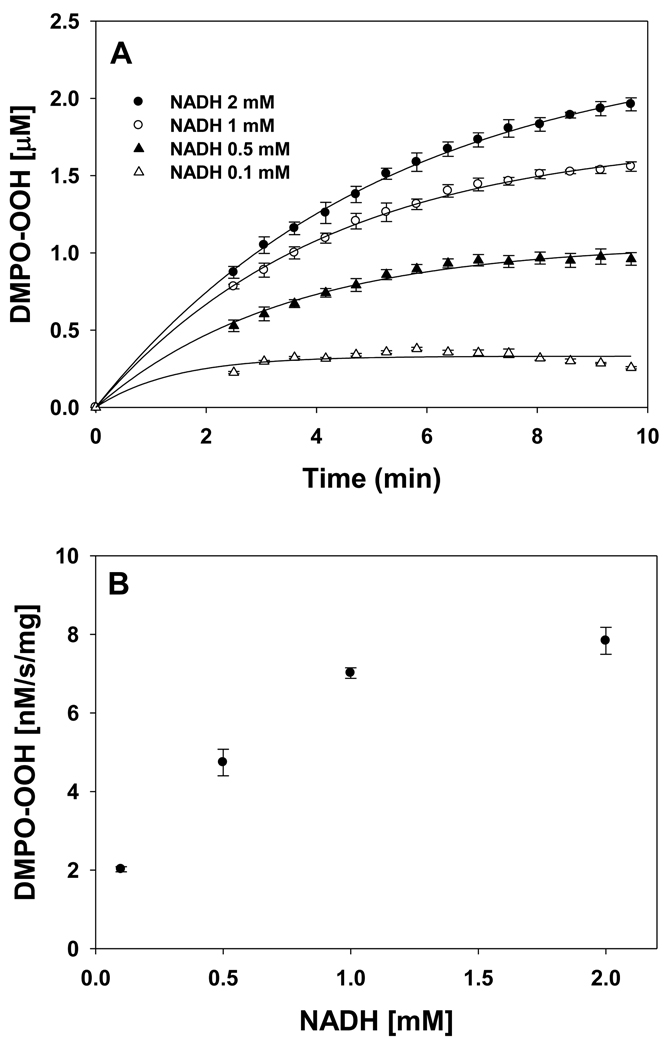
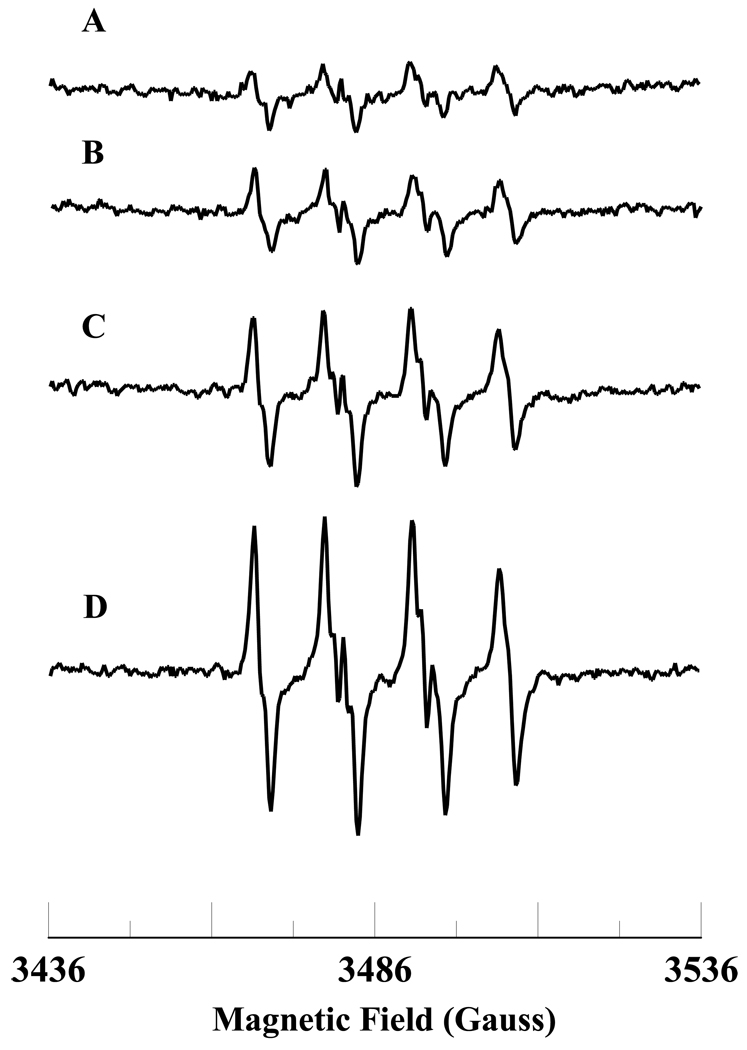
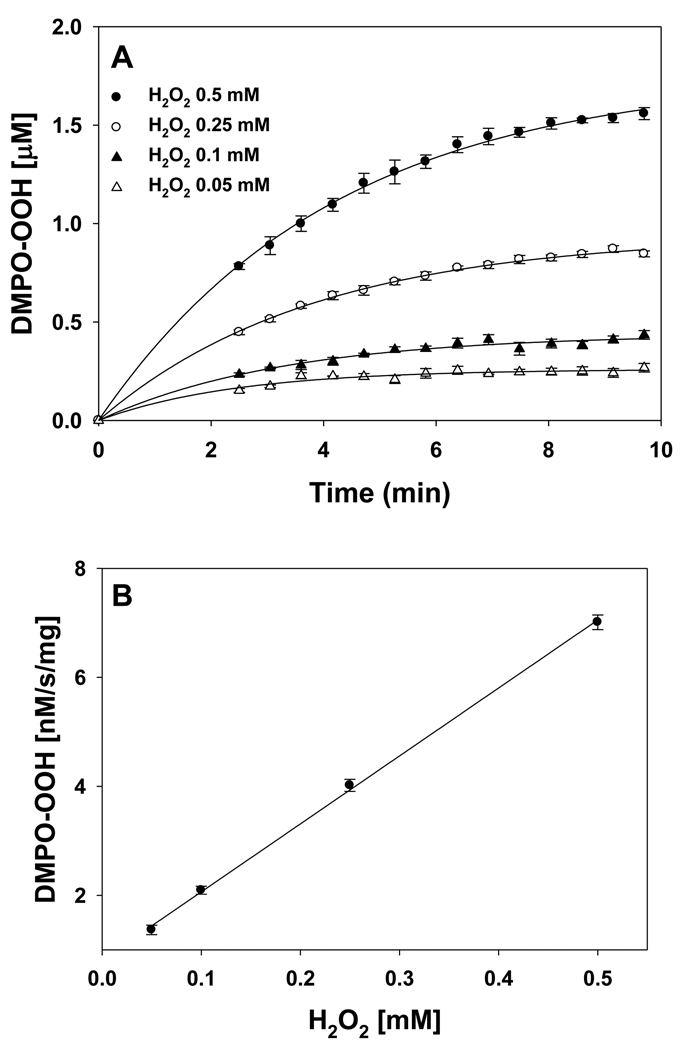
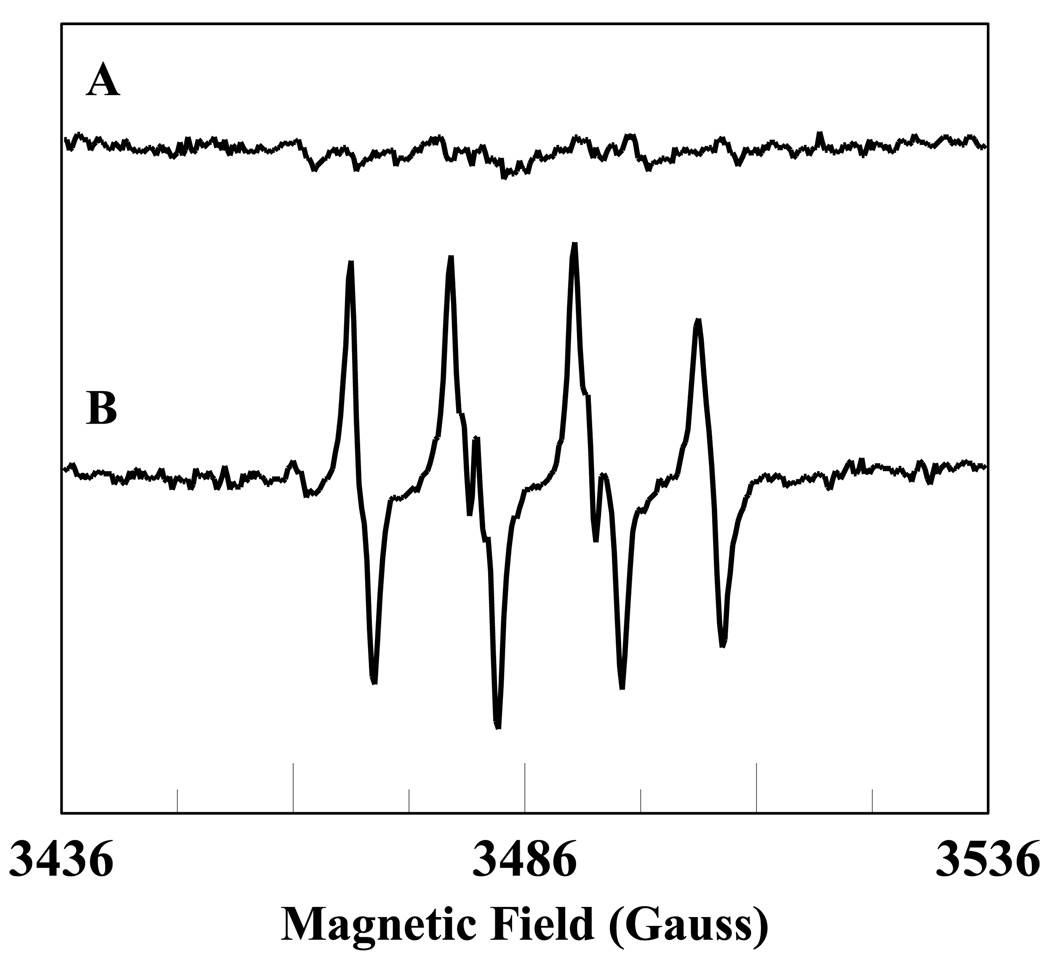
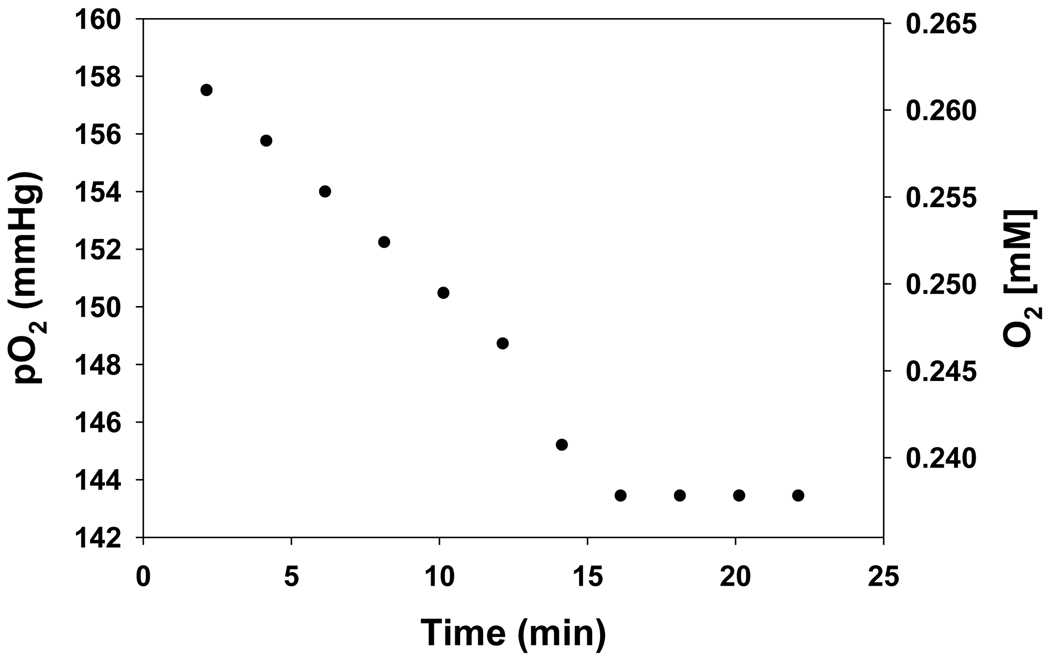
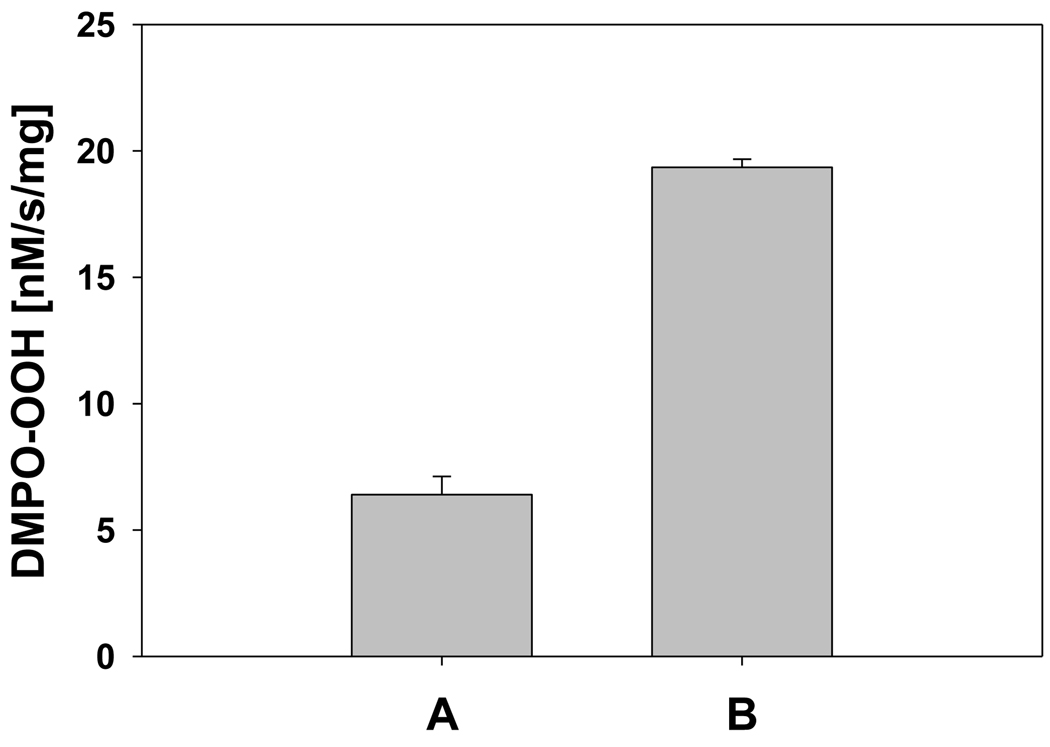
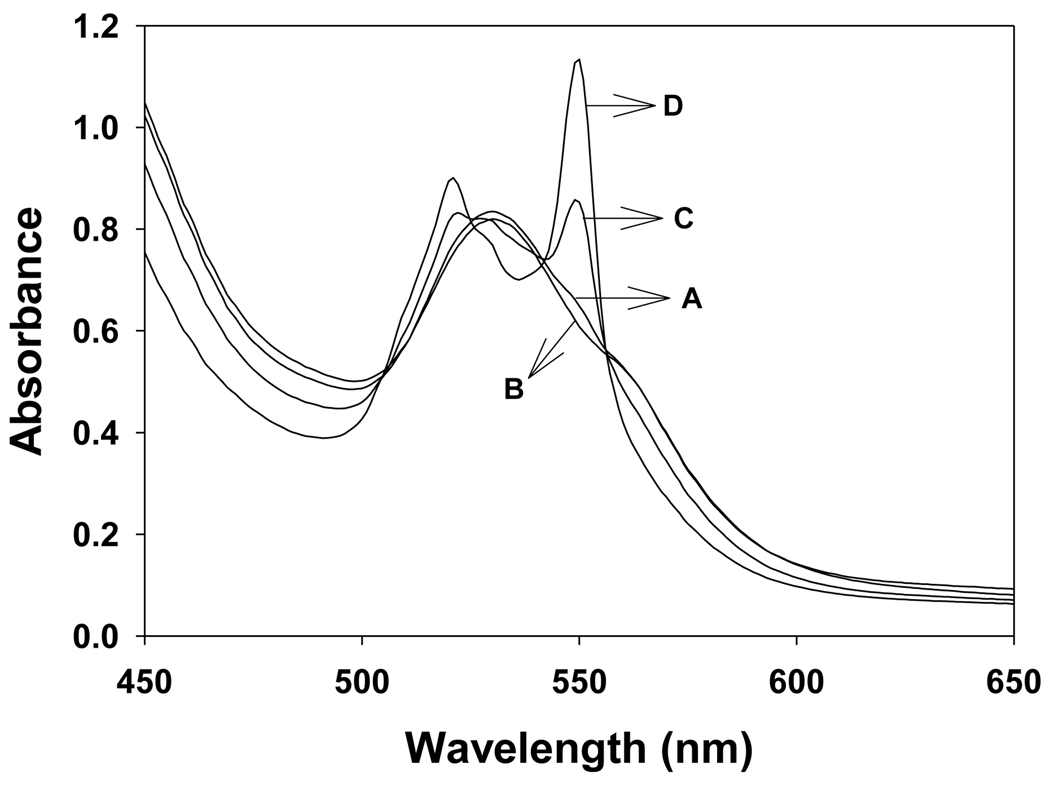
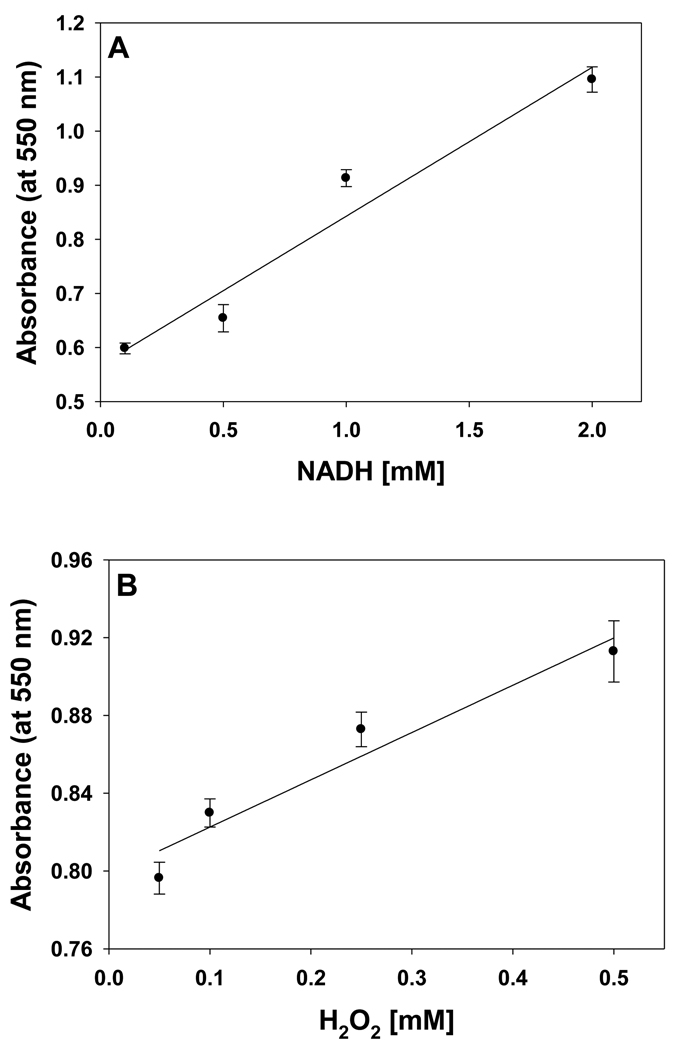
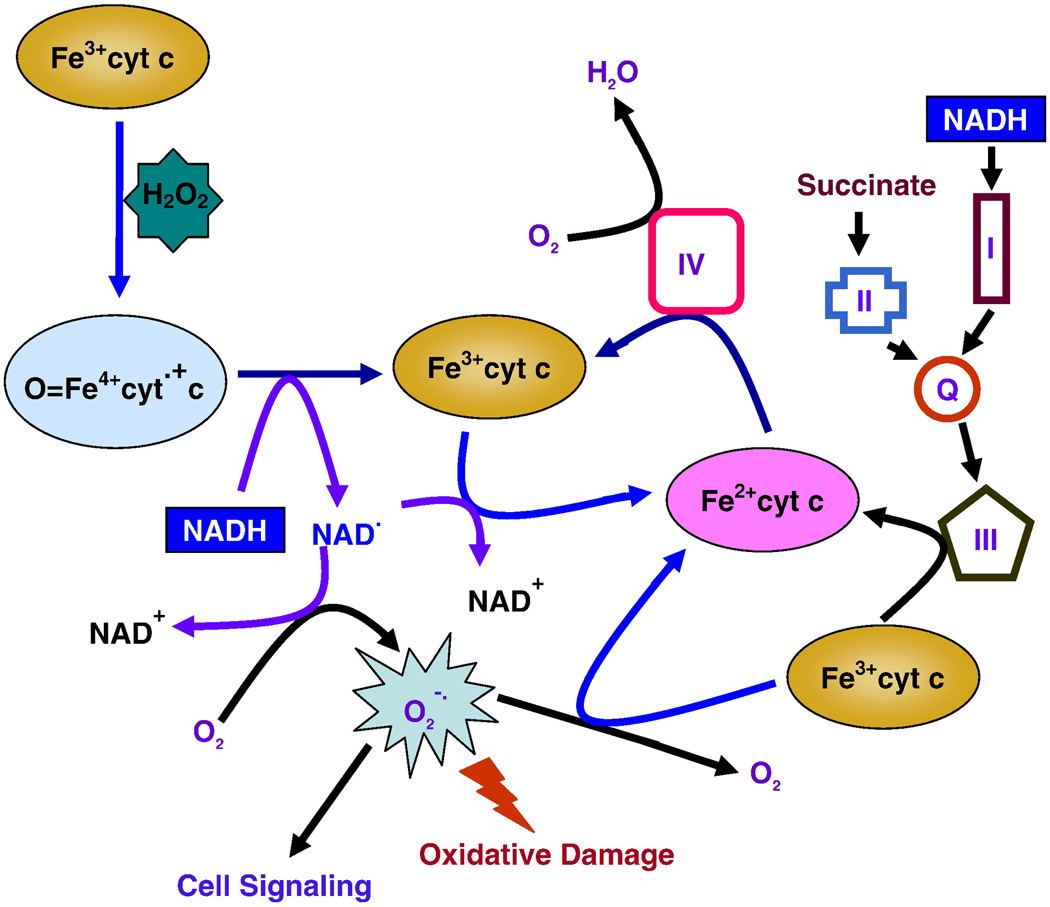
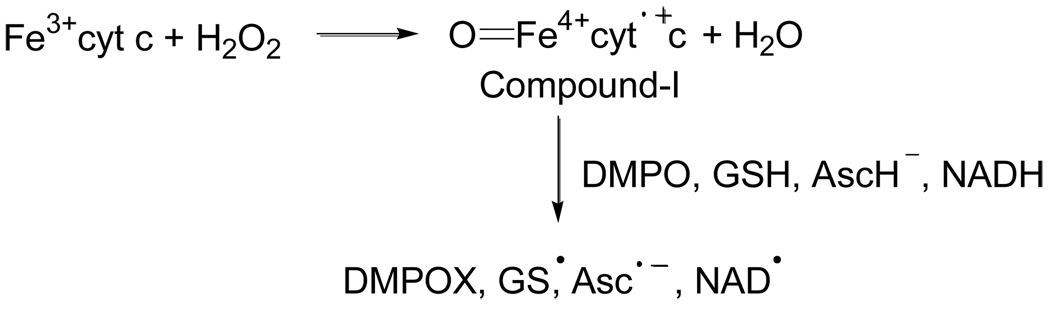
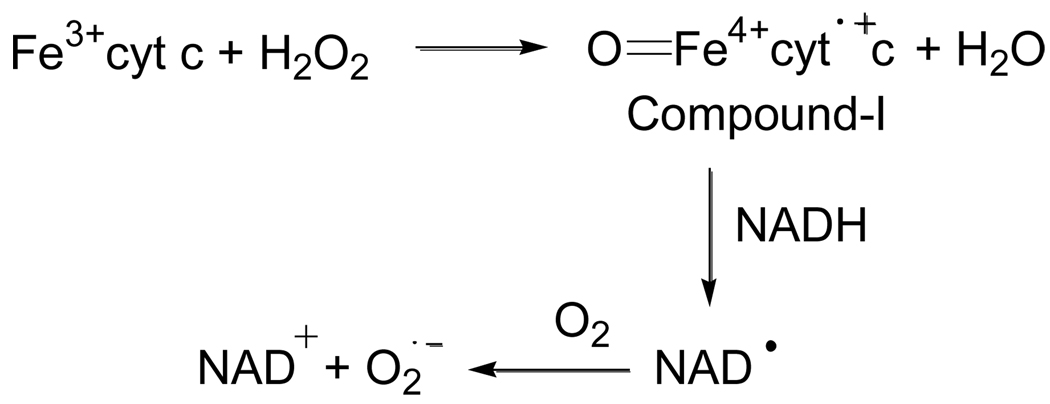
In cells, mitochondria, endoplasmic reticulum, and peroxisomes are the major sources of reactive oxygen species (ROS) under physiological and pathophysiological conditions. Cytochrome c (cyt c) is known to participate in mitochondrial electron transport and has antioxidant and peroxidase activities. Under oxidative or nitrative stress, the peroxidase activity of Fe³⁺cyt c is increased. The level of NADH is also increased under pathophysiological conditions such as ischemia and diabetes and a concurrent increase in hydrogen peroxide (H₂O₂) production occurs. Studies were performed to understand the related mechanisms of radical generation and NADH oxidation by Fe³⁺cyt c in the presence of H₂O₂. Electron paramagnetic resonance (EPR) spin trapping studies using 5,5-dimethyl-1-pyrroline-N-oxide (DMPO) were performed with NADH, Fe³⁺cyt c, and H₂O₂ in the presence of methyl-β-cyclodextrin. An EPR spectrum corresponding to the superoxide radical adduct of DMPO encapsulated in methyl-β-cyclodextrin was obtained. This EPR signal was quenched by the addition of the superoxide scavenging enzyme Cu,Zn-superoxide dismutase (SOD1). The amount of superoxide radical adduct formed from the oxidation of NADH by the peroxidase activity of Fe³⁺cyt c increased with NADH and H₂O₂ concentration. From these results, we propose a mechanism in which the peroxidase activity of Fe³⁺cyt c oxidizes NADH to NAD(•), which in turn donates an electron to O₂, resulting in superoxide radical formation. A UV-visible spectroscopic study shows that Fe³⁺cyt c is reduced in the presence of both NADH and H₂O₂. Our results suggest that Fe³⁺cyt c could have a novel role in the deleterious effects of ischemia/reperfusion and diabetes due to increased production of superoxide radical. In addition, Fe³⁺cyt c may play a key role in the mitochondrial "ROS-induced ROS-release" signaling and in mitochondrial and cellular injury/death. The increased oxidation of NADH and generation of superoxide radical by this mechanism may have implications for the regulation of apoptotic cell death, endothelial dysfunction, and neurological diseases. We also propose an alternative electron transfer pathway, which may protect mitochondria and mitochondrial proteins from oxidative damage.


Figures

Figure 1
Figure 1
Room temperature EPR spectra of the superoxide radical adduct of DMPO, DMPO-OOH. All the reactions were performed in 50 mM phosphate buffer (pH = 7.4) containing 0.1 mM DTPA. Spectrum A: DMPO (50 mM), methyl-β-cyclodextrin (0.1 M), Fe3+cyt c (0.1 mM), NADH (1 mM), and H2O2 (0.5 mM). Spectrum B: DMPO (50 mM), methyl-β-cyclodextrin (0.1 M), NADH (1 mM), and H2O2 (0.5 mM). Spectrum C: DMPO (50 mM), Fe3+cyt c (0.1 mM), NADH (1 mM), and H2O2 (0.5 mM). Spectrum D: DMPO (50 mM), methyl-β-cyclodextrin (0.1 M), Fe3+cyt c (0.1 mM), SOD1 (500 U/mL), NADH (1 mM), and H2O2 (0.5 mM). Spectrum E: DMPO (50 mM), methyl-β-cyclodextrin (0.1 M), Fe3+cyt c (0.1 mM), and H2O2 (0.5 mM). Spectrum F: DMPO (50 mM), methyl-β-cyclodextrin (0.1 M), Fe3+cyt c (0.1 mM), and NADH (1 mM). The observed isotropic hyperfine values of the DMPO-OOH adducts are aN = 13.49 G, aH1 = 10.78 G, and aH2 = 1.39 G. EPR instrument parameters used were as described in the materials and methods section.
Figure 2
Figure 2
Room temperature EPR spectra of the superoxide radical adduct of DMPO, DMPO-OOH. All the reactions were performed in 50 mM phosphate buffer (pH = 7.4) containing 0.1 mM DTPA. Spectrum A: DMPO (50 mM), methyl-β-cyclodextrin (0.1 M), Fe3+cyt c (0.1 mM), NADH (0.1 mM), and H2O2 (0.5 mM). Spectrum B: DMPO (50 mM), methyl-β-cyclodextrin (0.1 M), Fe3+cyt c (0.1 mM), NADH (0.5 mM), and H2O2 (0.5 mM). Spectrum C: DMPO (50 mM), methyl-β-cyclodextrin (0.1 M), Fe3+cyt c (0.1 mM), NADH (1 mM), and H2O2 (0.5 mM). Spectrum D: DMPO (50 mM), methyl-β-cyclodextrin (0.1 M), Fe3+cyt c (0.1 mM), NADH (2 mM), and H2O2 (0.5 mM). EPR instrument parameters used were as described in the materials and methods section.
Figure 3
Figure 3
(A) Plot of the concentration of superoxide radical adduct of DMPO (DMPO-OOH) vs time for various concentrations of NADH. Experiments were performed with DMPO (50 mM), methyl-β-cyclodextrin (0.1 M), Fe3+cyt c (0.1 mM), H2O2 (0.5 mM) and various concentrations of NADH in phosphate buffer containing DTPA (0.1 mM). (B) Plot of initial rate of formation of superoxide radical adducts of DMPO (DMPO-OOH) vs NADH concentrations. Rates in panel B were obtained from the initial slope of the data from panel A. EPR spectra were quantified by computer simulation of the spectra and comparison of the double integral of the observed signal with that of a TEMPO standard (1 µM) measured under the identical conditions. Data represent means ± S.E (n = 3).
Figure 4
Figure 4
Room temperature EPR spectra of the superoxide radical adduct of DMPO, DMPO-OOH. All the reactions were performed in 50 mM phosphate buffer (pH = 7.4) containing 0.1 mM DTPA. Spectrum A: DMPO (50 mM), methyl-β-cyclodextrin (0.1 M), Fe3+cyt c (0.1 mM), NADH (1 mM), and H2O2 (0.05 mM). Spectrum B: DMPO (50 mM), methyl-β-cyclodextrin (0.1 M), Fe3+cyt c (0.1 mM), NADH (1 mM), and H2O2 (0.1 mM). Spectrum C: DMPO (50 mM), methyl-β-cyclodextrin (0.1 M), Fe3+cyt c (0.1 mM), NADH (1 mM), and H2O2 (0.25 mM). Spectrum D: DMPO (50 mM), methyl-β-cyclodextrin (0.1 M), Fe3+cyt c (0.1 mM), NADH (1 mM), and H2O2 (0.5 mM). EPR instrument parameters used were as described in the materials and methods section.
Figure 5
Figure 5
(A) Plot of the concentration of superoxide radical adduct of DMPO (DMPO-OOH) vs time for various concentrations of H2O2. Experiments were performed with DMPO (50 mM), methyl-β-cyclodextrin (0.1 M), Fe3+cyt c (0.1 mM), NADH (1 mM), and various concentrations of H2O2 in phosphate buffer containing DTPA (0.1 mM). (B) Plot of initial rate of formation of superoxide radical adducts of DMPO (DMPO-OOH) vs H2O2 concentrations. Rates in panel B were obtained from the initial slope of the data from panel A. EPR spectra were quantified by computer simulation of the spectra and comparison of the double integral of the observed signal with that of a TEMPO standard (1 µM) measured under the identical conditions. Data represent means ± S.E (n = 3).
Figure 6
Figure 6
Room temperature EPR spectra of the superoxide radical adduct of DMPO, DMPO-OOH. All the reactions were performed in 50 mM phosphate buffer (pH = 7.4) containing 0.1 mM DTPA. The reaction mixture contains DMPO (50 mM), methyl-β-cyclodextrin (0.1 M), Fe3+cyt c (0.1 mM), NADH (1 mM), and H2O2 (0.5 mM). Spectrum A: The reaction mixture was prepared inside the nitrogen filled glove box. Spectrum B: The reactants were taken out from the glove box and the reaction mixture was prepared under room air. EPR instrument parameters used were as described in the materials and methods section.
Figure 7
Figure 7
Plot of the oxygen consumption in phosphate buffer containing Fe3+cyt c (0.1 mM), NADH (1 mM), and H2O2 (0.5 mM) using the EPR oximetry probe LiPc. Line width from the EPR spectra were converted into partial pressure of oxygen using the calibration formula of pO2 = (Line width G − 0.1748)/0.005684. EPR instrument parameters used were microwave frequency 9.775, modulation frequency 100 kHz, modulation amplitude 0.1 G, microwave power 1 mW, number of scans 1, scan time 10.5 s, and time constant 82 ms. The partial pressure of oxygen was converted into dissolved concentration based on the solubility of oxygen in water at room air of 0.265 mM [38].
Figure 8
Figure 8
Oxidation of Fe3+cyt c to M-Fe3+cyt c by HOCl increases the initial rate of formation of superoxide radical adducts of DMPO (DMPO-OOH). The preparation of M-Fe3+cyt c is described in the materials and methods section. EPR spin trapping experiments were performed with DMPO (50 mM), methyl-β-cyclodextrin (0.1 M), Fe3+cyt c/M-Fe3+cyt c (0.1 mM), NADH (1 mM), and H2O2 (0.5 mM) in phosphate buffer containing DTPA (0.1 mM). A: Fe3+cyt c. B: M-Fe3+cyt c. EPR spectra were quantified by computer simulation of the spectra and comparison of the double integral of the observed signal with that of a TEMPO standard (1 µM) measured under the identical conditions. Initial rates were calculated and mean ± S.E shown in graph (n = 3).
Figure 9
Figure 9
UV-visible absorption spectra of cyt c in phosphate buffer, pH 7.4. Experiments were performed with Fe3+cyt c, NADH, and H2O2. Reactions were initiated by the addition of H2O2. Spectra were recorded five minutes after mixing all the reactants. A: Fe3+cyt c (0.1 mM), B: Fe3+cyt c (0.1 mM) and H2O2 (0.5 mM), C: Fe3+cyt c (0.1 mM) and NADH (2 mM), D: Fe3+cyt c (0.1 mM), NADH (2 mM), and H2O2 (0.5 mM).
Figure 10
Figure 10
The effect of NADH and H2O2 on the reduction of Fe3+cyt c in phosphate buffer, pH 7.4. Experiments were performed with Fe3+cyt c, NADH, and H2O2. Reactions were initiated by the addition of H2O2. UV-visible absorption spectra were recorded five minutes after mixing all the reactants. A: Fe3+cyt c (0.1 mM), NADH (0.1 – 2 mM), and H2O2 (0.5 mM). B: Fe3+cyt c (0.1 mM), NADH (1 mM), and H2O2 (0.05 – 0.5 mM). Data represent means ± S.E (n = 3).
Figure 11
Figure 11
Proposed model of cytochrome c mediated removal of H2O2, oxidation of NADH, generation of superoxide radical, and alternative electron transfer pathway in mitochondria.
Scheme 1
Scheme 1
Scheme 2
Scheme 2

References

    1. Tu BP, Weissman JS. Oxidative protein folding in eukaryotes: mechanisms and consequences. J. Cell Biol. 2004;164:341–346. - PMC - PubMed
    1. St-Pierre J, Buckingham JA, Roebuck SJ, Brand MD. Topology of superoxide production from different sites in the mitochondrial electron transport chain. J. Biol. Chem. 2002;277:44784–44790. - PubMed
    1. Antonenkov VD, Grunau S, Ohlmeier S, Hiltunen JK. Peroxisomes are oxidative organelles. Antioxid. Redox. Signal. 2010;13:525–537. - PubMed
    1. O'Rourke B, Cortassa S, Aon MA. Mitochondrial ion channels: gatekeepers of life and death. Physiology (Bethesda) 2005;20:303–315. - PMC - PubMed
    1. Baines CP, Kaiser RA, Purcell NH, Blair NS, Osinska H, Hambleton MA, Brunskill EW, Sayen MR, Gottlieb RA, Dorn GW, Robbins J, Molkentin JD. Loss of cyclophilin D reveals a critical role for mitochondrial permeability transition in cell death. Nature. 2005;434:658–662. - PubMed

Publication types

MeSH terms

LinkOut - more resources