. 2011 Dec;30(6):1022-38.
doi: 10.1016/j.humov.2010.09.007. Epub 2011 May 4.

The interaction of respiration and visual feedback on the control of force and neural activation of the agonist muscle

Affiliations

The interaction of respiration and visual feedback on the control of force and neural activation of the agonist muscle

Harsimran S Baweja et al. Hum Mov Sci. 2011 Dec.

Abstract

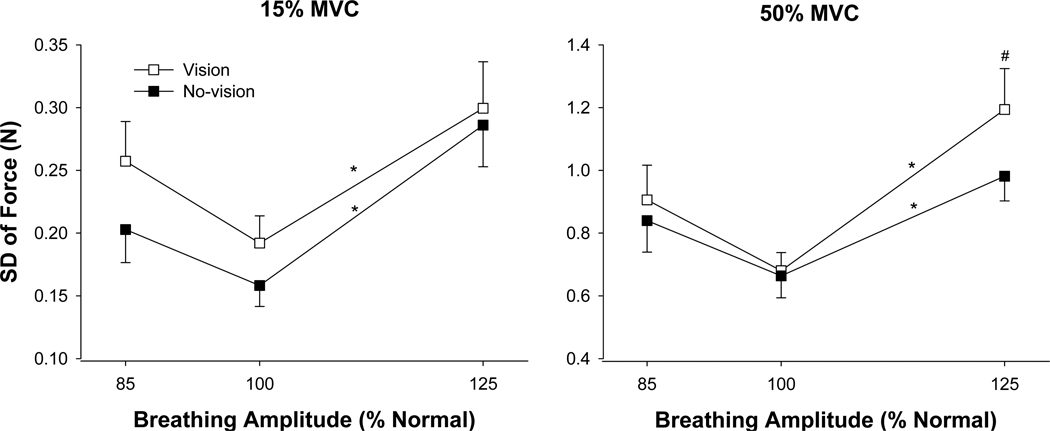
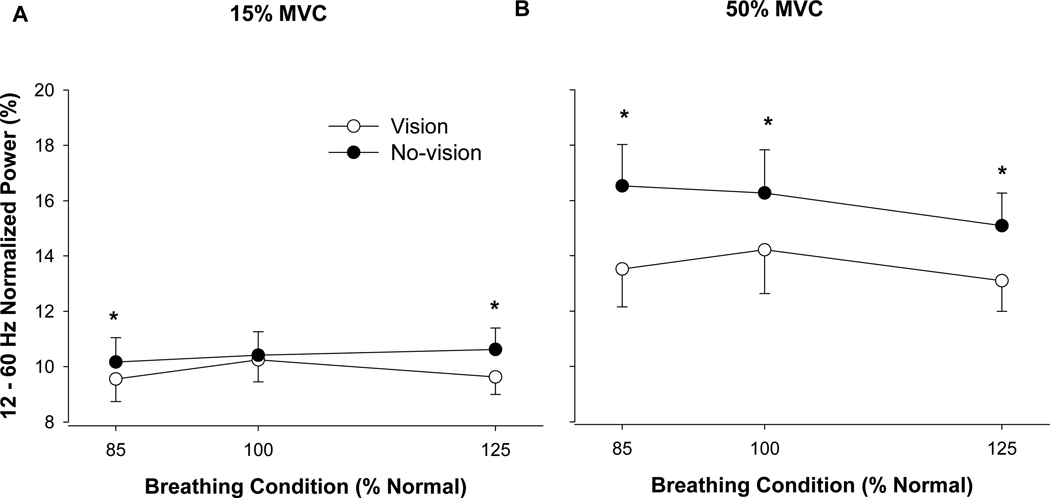
The purpose of this study was to compare force variability and the neural activation of the agonist muscle during constant isometric contractions at different force levels when the amplitude of respiration and visual feedback were varied. Twenty young adults (20-32 years, 10 men and 10 women) were instructed to accurately match a target force at 15% and 50% of their maximal voluntary contraction (MVC) with abduction of the index finger while controlling their respiration at different amplitudes (85%, 100% and 125% normal) in the presence and absence of visual feedback. Each trial lasted 22s and visual feedback was removed from 8-12 and 16-20s. Each subject performed three trials with each respiratory condition at each force level. Force variability was quantified as the standard deviation of the detrended force data. The neural activation of the first dorsal interosseus (FDI) was measured with bipolar surface electrodes placed distal to the innervation zone. Relative to normal respiration, force variability increased significantly only during high-amplitude respiration (∼63%). The increase in force variability from normal- to high-amplitude respiration was strongly associated with amplified force oscillations from 0 to 3 Hz (R(2) ranged from .68 to .84, p< .001). Furthermore, the increase in force variability was exacerbated in the presence of visual feedback at 50% MVC (vision vs. no-vision: .97 vs. .87N) and was strongly associated with amplified force oscillations from 0 to 1 Hz (R(2)= .82) and weakly associated with greater power from 12 to 30 Hz (R(2)= .24) in the EMG of the agonist muscle. Our findings demonstrate that high-amplitude respiration and visual feedback of force interact and amplify force variability in young adults during moderate levels of effort.


Figures

Fig. 1
Fig. 1
A) Constant isometric force task with the FDI muscle. Representative trial from 1 subject when exerting a constant force at 15% MVC with a visual angle of ~0.3°. Each subject was instructed to exert a force with abduction of the index finger against a force transducer and match the horizontal target line for 22 seconds. Visual feedback of the target line (red line) and exerted force (black trace) was given to the subjects from 0–8 s and 12–16 s (visual feedback condition), whereas visual feedback of the target and exerted force was removed (black bars) from 8–12 s and 16–20 s (no visual feedback condition). B) Respiration training: subjects were instructed to do the following: (a) control their respiration rate by inhaling through their nose with the same rate the horizontal bar was becoming red (dark grey) from left to right and exhaling through their mouth when the horizontal bar was becoming green (light grey) from right to left; (b) control their inhalation amplitude by inhaling through their nose and matching the target on the top vertical bar that was becoming red from bottom to top (towards the targeted line); (c) control their exhalation amplitude by exhaling through their mouth and matching the target on the bottom vertical bar that was becoming green from bottom to top (towards the targeted line).
Fig. 2
Fig. 2
Representative example of respiration, force and EMG of the FDI muscle. The top row represents the respiratory airflow trace, the middle row represents the force trace and the bottom row is the corresponding FDI EMG activity. The analysis was performed from 4 seconds prior to the removal of the visual feedback (visual feedback condition) and immediately 4 seconds after the removal of visual feedback (no visual feedback condition). The left column represents the data recorded from a subject during the normal-amplitude respiratory condition, whereas the right column represents the data recorded from the same subject during the high-amplitude respiratory condition.
Fig. 3
Fig. 3
SD of force during different respiratory and visual feedback conditions. The SD of force increased significantly (p < .001) with the level of force and on average was also significantly (p = .012) higher with visual feedback (open squares) compared with no-visual feedback (filled squares). The SD of force was significantly (*) higher with high-amplitude respiration during both feedback conditions at 15% MVC (left panel) and 50% MVC (right panel) compared with normal-amplitude respiration. At 50% MVC visual feedback exacerbated the SD of force during the high-amplitude respiratory condition (#).
Fig. 4
Fig. 4
CV of force during different respiratory and visual feedback conditions. The CV of force increased significantly (p < .001) with the level of force and was also significantly (p = .023) higher with visual feedback (open diamonds) compared with no-visual feedback (filled diamonds). The CV of force was significantly (*) greater with high-amplitude respiration compared with normal-amplitude respiration at both force levels. In addition, the CV of force was significantly (#) greater with high-amplitude respiration compared with low-amplitude respiration only at 15% MVC. Finally, on average, the CV of force was greater with visual feedback primarily due to differences at low- and normal-amplitude respiration at 15% MVC and high-amplitude respiration at 50% MVC.
Fig. 5
Fig. 5
Power spectrum of the force output. This figure demonstrates the change in power for the absolute (top row) and normalized (bottom row) power spectra of force in the presence (left column; open symbols) and absence of visual feedback (right column; filled symbols) during the various respiratory conditions (low-, normal-, and high-amplitude respiration). (A) In the presence of visual feedback subjects exhibited significantly greater absolute power of force during high-amplitude respiration from 0–1 and 1–3 Hz (*). (B) There were no differences in the absolute power spectra of force in the absence of visual feedback during all respiratory conditions. (C) In the presence of visual feedback subjects exhibited significantly greater (p = .002) normalized power from 0–1 Hz (*) and significantly (p < .001) lower normalized power from 3–7 Hz (#) during both the experimental respiratory conditions compared with normal-amplitude respiration. (D) In the absence of visual feedback subjects exhibited significantly greater (p = .002) normalized power from 0–1 Hz (*) and significantly (p < .001) lower normalized power from 3–7 Hz (#) during both experimental respiratory conditions compared with normal-amplitude respiration.
Fig. 6
Fig. 6
Cross-wavelet spectrum of the EMG output. This figure demonstrates a change in the normalized power spectra of the EMG signals from 12–60 Hz at 15% MVC (left panel) and 50% MVC (right panel) in the presence (open circles) and absence (filled circles) of visual feedback during the three respiratory conditions. (A) at 15% MVC the normalized power of the EMG signals was significantly lower in the presence of visual feedback (*) only during the experimental respiratory conditions. (B) At 50% MVC the normalized power was significantly lower in the presence of visual feedback (*) during all the respiratory conditions.
Fig. 7
Fig. 7
Associations between changes in SD of force and changes in force and EMG power spectra. For all conditions that significantly changed the SD of force, the increase in the SD of force was associated with an increase in force oscillations from 0–3 Hz. Nonetheless, the only condition that demonstrated a significant involvement of the primary agonist muscle (FDI) was the greater change in SD of force with high-amplitude respiration and visual feedback at 50% MVC. We found that the amplified force oscillations from 0–1 Hz with visual feedback at moderate force levels were associated with greater modulation at 12–30 Hz in the EMG signal of the primary agonist muscle (R2 = .24, p = .035).

References

    1. Addison PS. The illustrated wavelet transform handbook. New York: Taylor & Francis Group, New York; 2002.
    1. Baker SN, Olivier E, Lemon RN. Coherent oscillations in monkey motor cortex and hand muscle EMG show task-dependent modulation. Journal of Physiology. 1997;501(Pt 1):225–241. - PMC - PubMed
    1. Baweja HS, Kennedy DM, Vu JL, Vaillancourt DE, Christou EA. Greater amount of visual feedback decreases force variability by reducing force oscillations from 0–1 and 3–7 Hz. European Journal of Applied Physiology. 2010;108:935–943. - PMC - PubMed
    1. Baweja HS, Patel BK, Martinkewiz JD, Vu JL, Christou EA. Removal of visual feedback alters muscle activity and reduces force variability during constant isometric contractions. Experimental Brain Research. 2009;197:35–47. - PMC - PubMed
    1. Brown P. Cortical drives to human muscle: The Piper and related rhythms. Progress in Neurobiology. 2000;60:97–108. - PubMed

Publication types

LinkOut - more resources