. 2011 Jul;25(7):1145-58.
doi: 10.1210/me.2010-0495. Epub 2011 May 5.

Activation of the signal transducer and activator of transcription 3 pathway up-regulates estrogen receptor-beta expression in lung adenocarcinoma cells

Affiliations

Activation of the signal transducer and activator of transcription 3 pathway up-regulates estrogen receptor-beta expression in lung adenocarcinoma cells

Hao-Chen Wang et al. Mol Endocrinol. 2011 Jul.

Abstract

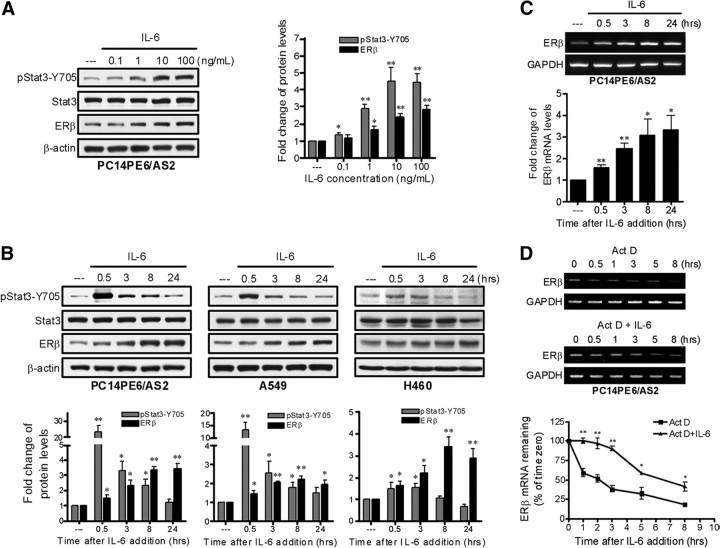
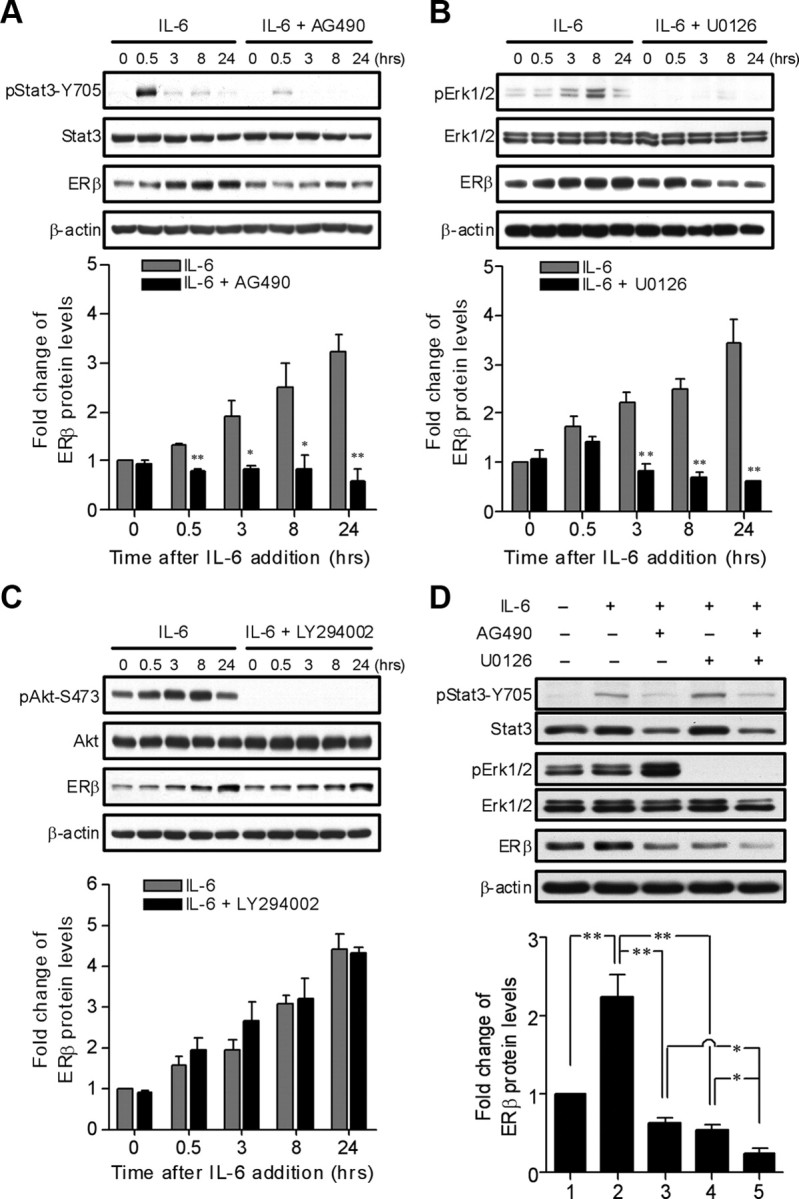
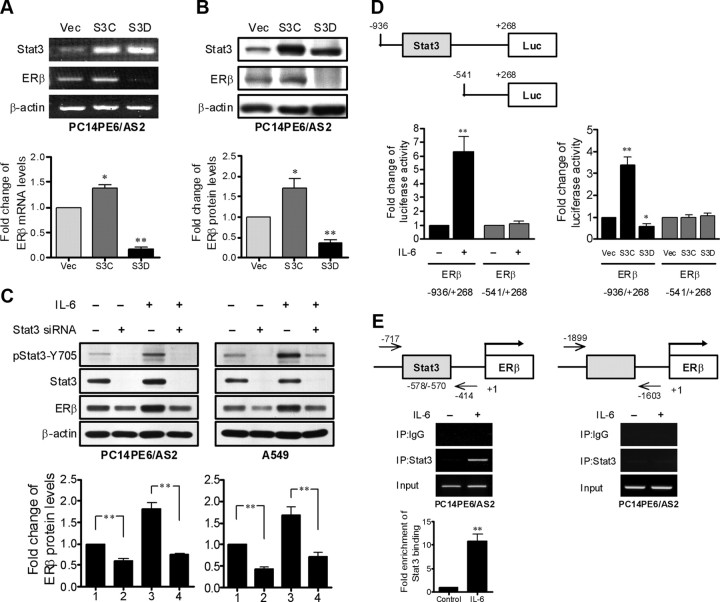
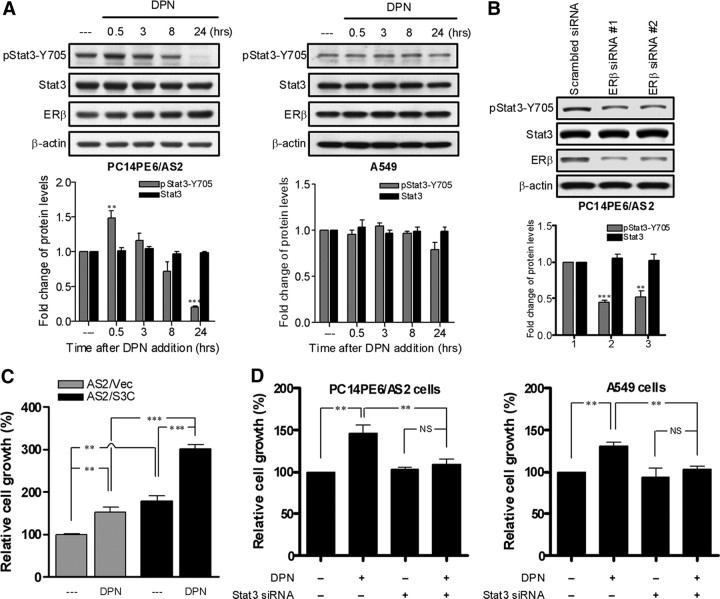
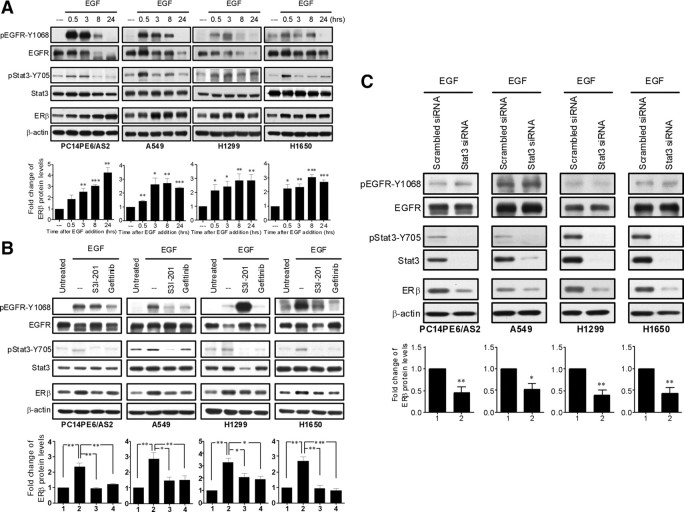
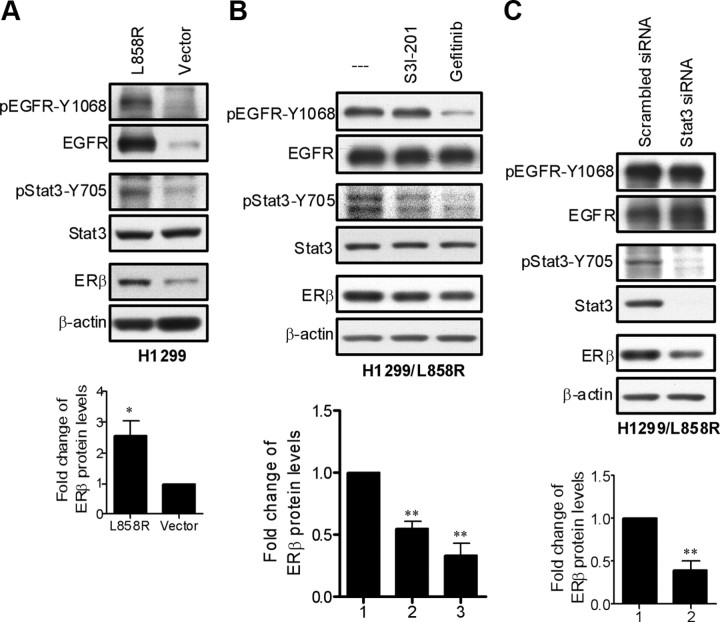
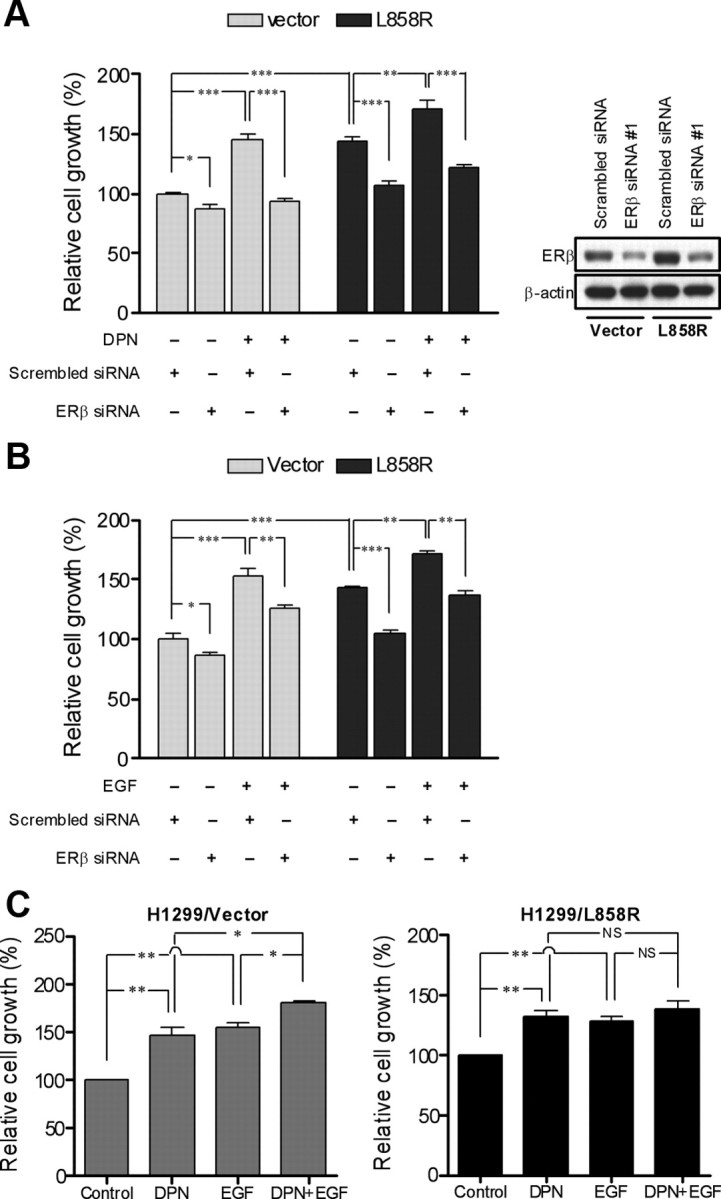
Estrogens contribute to the pathogenesis of female lung cancer and function mainly through estrogen receptor-β (ERβ). However, the way in which ERβ expression is regulated in lung cancer cells remains to be explored. We have found that signal transducer and activator of transcription 3 (Stat3) activation up-regulates ERβ expression in PC14PE6/AS2 lung cancer cells in a preliminary Affymetrix oligonucleotide array study, and we sought to confirm the findings. In this study, we show that IL-6 induced ERβ mRNA and protein expression in lung cancer cells. The induction of ERβ in response to IL-6 was abolished by Janus kinase 2 inhibitor-AG490, dominant-negative mutant of Stat3, and Stat3-targeting short interfering RNA. The luciferase reporter assay and chromatin immunoprecipitation assay confirmed that IL-6-activated Stat3 binds to the ERβ promoter. Besides the Janus kinase 2/Stat3 pathway, the MEK/Erk pathway contributes to ERβ up-regulation induced by IL-6; however, the phosphoinositide 3'-kinase/Akt pathway does not. We also found that epidermal growth factor (EGF) stimulation or L858R mutation in EGF receptor (EGFR) induced Stat3 activation as well as ERβ expression in lung cancer cells. Inhibiting Stat3 activity by pharmacological or genetic approaches reduced EGF- and L858R mutant EGFR-induced ERβ expression, indicating that Stat3 activation is required for EGFR signaling-mediated ERβ up-regulation. Silencing ERβ decreased cell proliferation in lung cancer cells that overexpress L858R mutant EGFR. In conclusion, we have identified that Stat3 activation is essential for ERβ induction by IL-6, EGF, and the presence of EGFR mutation. The findings shed light on new therapeutic targets for female lung cancer, especially for those with EGFR mutations.


Figures

Fig. 1.
Fig. 1.
IL-6 up-regulates ERβ expression in lung cancer cells. A, PC14PE6/AS2 cells were subjected to serum starvation (0.5% FBS) overnight followed by treatment with IL-6 in different concentrations as indicated for 8 h. Tyrosine phosphorylation of Stat3 and ERβ expression were detected by Western blot analysis and normalized against total Stat3 and β-actin, respectively. Values represent the means ± sem from three separate experiments. *, P < 0.05; **, P < 0.01 vs. control. B, PC14PE6/AS2, A549, and H460 cells were serum starved (0.5% FBS) overnight followed by treatment with a fixed dosage of IL-6 (10 ng/ml) for the indicated time points. Total cell lysates were prepared and subjected to Western blotting with phospho-Stat3–Y705, general Stat3, and ERβ antibodies. Tyrosine phosphorylation of Stat3 and ERβ expression were normalized against total Stat3 and β-actin, respectively. Values represent the means ± sem from at least three separate experiments. *, P < 0.05; **, P < 0.01 vs. control. C, PC14PE6/AS2 cells were serum starved (0.5% FBS) overnight followed by treatment with IL-6 (10 ng/ml) for the indicated time points. RNA samples were collected and ERβ mRNA expression was detected by RT-PCR. The levels of ERβ mRNA were normalized by comparison of GAPDH content. The bar graph is from three different experiments, means ± sem. *, P < 0.05; **, P < 0.01 vs. control. D, PC14PE6/AS2 cells were serum starved (0.5% FBS) overnight and then pretreated with actinomycin D (Act D) (2 μg/ml) for 1 h followed by addition with or without IL-6 (10 ng/ml) for the indicated time points. Total RNA were collected and analyzed by RT-PCR. The levels of ERβ mRNA were normalized by comparison of GAPDH content and expressed as the percent change of time zero, which was set at 100%. Values represent the means ± sem of three independent experiments. *, P < 0.05; **, P < 0.01 for Act D vs. Act D + IL-6 at each time point.
Fig. 2.
Fig. 2.
Jak2/Stat3 and MEK/ERK as downstream signaling pathways of IL-6 contribute to the regulation of ERβ expression. A–C, PC14PE6/AS2 cells were serum starved (0.5% FBS) overnight followed by pretreatment with or without the Jak2/Stat3 inhibitor (AG490, 40 μm), the PI3K/Akt inhibitor (LY294002, 20 μm), or the MEK/ERK inhibitor (U0126, 5 μm) for 1 h and then incubated with IL-6 (10 ng/ml) for the indicated time points. Whole-cell lysates were subjected to Western blotting with the indicated antibodies. β-Actin protein is shown as a loading control. The levels of ERβ were normalized against β-actin. Values represent the means ± sem of three independent experiments. *, P < 0.05; **, P < 0.01 for IL-6 vs. IL-6 + AG490, IL-6 vs. IL-6 + U0126, and IL-6 vs. IL-6 + LY294002 at each time point. D, PC14PE6/AS2 cells were serum starved (0.5% FBS) overnight followed by pretreatment with AG490 or U0126 or in combination for 1 h and then stimulated with IL-6 for 8 h. Total cell lysates were prepared and subjected to Western blotting analysis probed with the indicated antibodies. β-Actin protein is shown as a loading control. The levels of ERβ were normalized against β-actin. Values represent the means ± sem from three independent experiments. *, P < 0.05; **, P < 0.01, significant differences between groups.
Fig. 3.
Fig. 3.
ERβ expression is regulated by Stat3. A and B, The levels of ERβ mRNA and protein in the PC14PE6/AS2-derived cells stably expressing empty vector (Vec), constitutively active mutant of Stat3 (S3C), and dominant-negative mutant of Stat3 (S3D) were detected by RT-PCR and Western blotting, respectively. ERβ mRNA and protein levels were normalized with GAPDH and β-actin, respectively, and are presented as the means ± sem. *, P < 0.05; **, P < 0.01, compared with vector control cells. C, PC14PE6/AS2 and A549 cells were transfected with either scrambled control siRNA or synthetic Stat3 specific siRNA. At 48 h after the initiation of transfection, the cells were serum starved (0.5% FBS) overnight followed by treatment with or without IL-6 for 8 h. The cell extracts were collected and analyzed by Western blotting with phospho-Stat3–Y705, general Stat3, and ERβ antibodies. The levels of ERβ were normalized against β-actin. Values represent the means ± sem from three independent experiments. **, P < 0.01, significant differences between groups. D (left panel), PC14PE6/AS2 cells were cotransfected with pRL-TK plasmids in combination with either the −936/+268 (containing the putative Stat3 binding site) or the −541/+268 (with no putative Stat3 binding site) ERβ reporters. After 24 h of transfection, the cells were serum starved (0.5% FBS) overnight followed by treatment with or without IL-6 for 8 h and subjected to the dual-luciferase assay. The levels of firefly luciferase activity were normalized with Renilla luciferase activity serving as the internal control for transfection efficiency. The specific Stat3 binding sites within the human ERβ promoter were identified using TFSEARCH software (Parallel Application TRC Laboratory, RWCP, Tokyo, Japan). The results were presented as means ± sem from three independent experiments. *, P < 0.05; **, P < 0.01 vs. control. D (right panel), PC14PE6/AS2 cells stably expressing empty vector (Vec), constitutively active mutant of Stat3 (S3C), and dominant-negative mutant of Stat3 (S3D) were used to evaluate the activity of the −936/+268 or the −541/+268 ERβ reporters in a dual-luciferase reporter assay. The results were presented as means ± sem from three independent experiments. *, P < 0.05; **, P < 0.01, compared with Vec cells. E, The soluble chromatin was prepared from PC14PE6/AS2 cells exposed to IL-6 (10 ng/ml) for 0.5 h. The ChIP assay was performed using an antibody against Stat3 and an irrelevant αIgG antibody as negative control. The figure represents PCR products amplified from the final DNA extractions using pairs of primers on the ERβ promoter region as shown on the top panel. Values represent the means ± sem from three independent experiments. **, P < 0.01 vs. control.
Fig. 4.
Fig. 4.
The interaction between Stat3 and ERβ contributes to estrogen-dependent cell growth. A, PC14PE6/AS2 and A549 cells were depleted of estrogen by culture in phenol red-free medium containing 10% charcoal-stripped serum for 24 h followed by starvation in medium with 0.5% charcoal-stripped serum overnight. The cells were then incubated with ERβ-specific agonist DPN (10 nm) for the indicated time points. Tyrosine phosphorylation of Stat3 and total Stat3 expression were detected by Western blot analysis and normalized against total Stat3 and β-actin, respectively. Values represent the means ± sem from three separate experiments. B, PC14PE6/AS2 cells were transiently transfected with either scrambled control siRNA or ERβ-specific siRNA. After 48 h of culture, the whole-cell extracts were prepared and detected by Western blot analysis probed with Stat3 and ERβ antibodies. The levels of Stat3 protein were normalized with β-actin. Values represent the means ± sem from three separate experiments. C, PC14PE6/AS2-derived cells stably expressing empty vector (Vec) or constitutively active mutant of Stat3 (S3C) were grown in 96-well plates with phenol red-free medium containing 10% charcoal-stripped serum for 24 h, serum starved in medium with 0.5% charcoal-stripped serum for 24 h, and then incubated with or without DPN for 48 h. Cell proliferation was measured by the MTT assay. Values represent the mean ± sem of six identical wells. **, P < 0.01; ***, P < 0.01, significant differences between groups. D, PC14PE6/AS2 and A549 cells transiently transfected with either scrambled control siRNA or Stat3-specific siRNA were grown in 96-well plates with phenol red-free medium containing 10% charcoal-stripped serum for 24 h. The cells were then serum starved in medium with 0.5% charcoal-stripped serum for 24 h followed by treatment with or without DPN for 48 h under low serum (0.5% FBS) condition. Cell proliferation was measured by the MTT assay. Values represent the mean ± sem of six identical wells. NS, Not significant. *, P < 0.05; **, P < 0.01, significant differences between groups.
Fig. 5.
Fig. 5.
Stat3 activation is involved in EGF-induced ERβ expression in lung cancer cells. A, PC14PE6/AS2, A549, H1299, and H1650 cells were serum starved (0.5% FBS) overnight followed by treatment with EGF (10 ng/ml) for the indicated time points. Total cell lysates were collected and time course of ERβ expression and the phosphorylation status of both EGFR and Stat3 were analyzed by Western blotting. The levels of ERβ protein were normalized with β-actin. Values represent the means ± sem from at least three separate experiments. *, P < 0.05; **, P < 0.01; ***, P < 0.001 vs. control. B, Cells were serum starved (0.5% FBS) overnight and then pretreated with Stat3 inhibitor (S3I-201, 100 μm) or EGFR inhibitor (gefitinib, 2 μm) for 3 h followed by stimulation with EGF (10 ng/ml) for 8 h. The cell extracts were collected and analyzed by Western blotting probed with the indicated antibodies. The levels of ERβ were normalized against β-actin and presented as means ± sem from three independent experiments. *, P < 0.05; **, P < 0.01; ***, P < 0.001, significant differences between groups. C, Cells were transiently transfected with either scrambled control siRNA- or Stat3-specific siRNA. After 48 h of incubation, cells were starved (0.5% FBS) overnight followed by treatment with EGF (10 ng/ml) for 8 h. The lysates of these cells were analyzed by Western blotting probed with the indicated antibodies. The levels of ERβ were normalized against β-actin and presented as means ± sem from three independent experiments. *, P < 0.05; **, P < 0.01, vs. scrambled control.
Fig. 6.
Fig. 6.
ERβ expression is up-regulated by L858R mutant EGFR via Stat3 activation. A, The levels of ERβ and phosphorylation status of both EGFR and Stat3 were compared between H1299 cells stably expressing an empty vector and L858R mutant EGFR by Western blotting. The levels of ERβ were normalized against β-actin. Values represent the means ± sem from three experiments. *, P < 0.05 vs. vector control cells. B, H1299/L858R cells were left untreated, treated with Stat3 inhibitor (S3I-201, 100 μm) or EGFR inhibitor (gefitinib, 2 μm) for 8 h. The cell extracts were collected and analyzed by Western blotting probed with the indicated antibodies. The levels of ERβ were normalized against β-actin. Values represent the means ± sem from three separate experiments. **, P < 0.01 vs. control. C, H1299/L858R cells were transiently transfected with Stat3 specific siRNA to silence Stat3 expression. Scrambled siRNA served as negative control. The cell lysates were detected by Western blot analysis probed with the indicated antibodies. The levels of ERβ were normalized against β-actin. Values represent the means ± sem from three separate experiments. **, P < 0.01 vs. scrambled control.
Fig. 7.
Fig. 7.
ERβ contributes to L858R mutant EGFR-induced cell growth. A, Transfection of H1299/vector and H1299/L858R cells with either scrambled control siRNA or ERβ-specific siRNA was performed, and the cells were grown in 96-well plates for 24 h. The cells were then serum starved (0.5% FBS) for 24 h followed by treatment with or without EGF for 48 h under low serum (0.5% FBS) condition. Cell proliferation was measured by MTT assay. Values represent the mean ± sem of six identical wells. *, P < 0.05; **, P < 0.01; ***, P < 0.001, significant differences between groups. siRNA knockdown of ERβ protein was confirmed by immunoblot after 48 h of transfection as shown on the right panel. B, H1299/vector and H1299/L858R cells transiently transfected with either scrambled control siRNA or ERβ-specific siRNA were grown in 96-well plates in phenol red-free medium containing 10% charcoal-stripped serum for 24 h. The cells were serum starved in medium with 0.5% charcoal-stripped serum for 24 h followed by treatment with or without DPN for 48 h under low serum (0.5% FBS) condition. Cell proliferation was measured by an MTT assay. Values represent the mean ± sem of six identical wells. *, P < 0.05; **, P < 0.01; ***, P < 0.001, significant differences between groups. C, H1299/vector and H1299/L858R cells were grown in 96-well plates in phenol red-free medium containing 10% charcoal-stripped serum for 24 h, serum starved (0.5% charcoal stripped serum) for 24 h, and then treated with DPN, EGF, or in combination for 48 h under low serum (0.5% FBS) condition. Measurement of cell proliferation was carried out by an TT assay. Values represent the mean ± sem of six identical wells. NS, Not significant. *, P < 0.05; **, P < 0.01, significant differences between groups.

Similar articles

Cited by

References

    1. Siegfried JM. 2001. Women and lung cancer: does oestrogen play a role? Lancet Oncol 2:506–513 - PubMed
    1. Lam WK. 2005. Lung cancer in Asian women—the environment and genes. Respirology 10:408–417 - PubMed
    1. Ger LP , Liou SH , Shen CY , Kao SJ , Chen KT. 1992. [Risk factors of lung cancer]. J Formos Med Assoc 91(Suppl 3):S222–S231 - PubMed
    1. Xu X , Li B , Wang L. 1994. Gender difference in smoking effects on adult pulmonary function. Eur Respir J 7:477–483 - PubMed
    1. Zang EA , Wynder EL. 1996. Differences in lung cancer risk between men and women: examination of the evidence. J Natl Cancer Inst 88:183–192 - PubMed

Publication types

MeSH terms