. 2011 Jul;188(3):663-72.
doi: 10.1534/genetics.111.126466. Epub 2011 May 5.

Inferring epidemiological parameters on the basis of allele frequencies

Affiliations

Inferring epidemiological parameters on the basis of allele frequencies

Tanja Stadler. Genetics. 2011 Jul.

Abstract

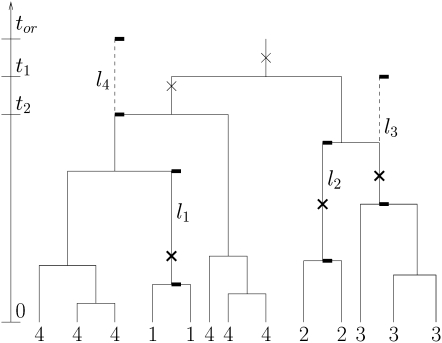
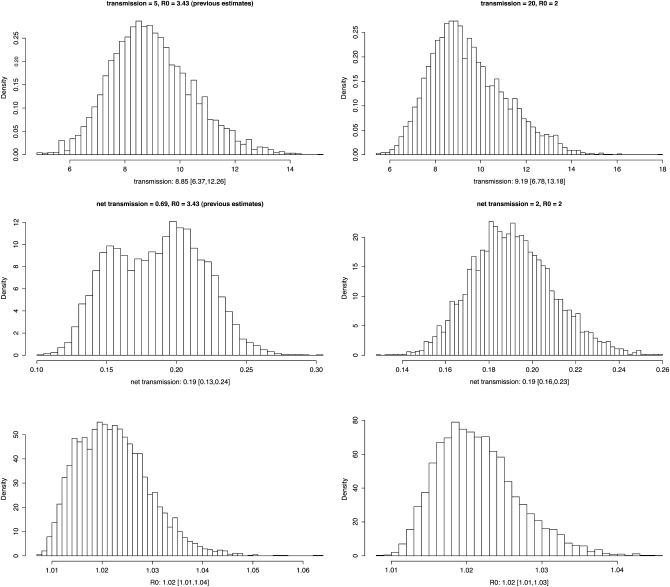
In this article, I develop a methodology for inferring the transmission rate and reproductive value of an epidemic on the basis of genotype data from a sample of infected hosts. The epidemic is modeled by a birth-death process describing the transmission dynamics in combination with an infinite-allele model describing the evolution of alleles. I provide a recursive formulation for the probability of the allele frequencies in a sample of hosts and a Bayesian framework for estimating transmission rates and reproductive values on the basis of observed allele frequencies. Using the Bayesian method, I reanalyze tuberculosis data from the United States. I estimate a net transmission rate of 0.19/year [0.13, 0.24] and a reproductive value of 1.02 [1.01, 1.04]. I demonstrate that the allele frequency probability under the birth-death model does not follow the well-known Ewens' sampling formula that holds under Kingman's coalescent.


Figures

F<sc>igure</sc> 1.—
Figure 1.—
A transmission tree Ta induced under the constant rate birth-death model (BDM) as a model for transmission. Mutations of an allele are modeled using the infinite-allele model (IAM). The four allele types of the leaves are labeled by 1−4, and the allele frequency is a = (0, 2, 10, 0, 1). The root edge lengths l1, … , l4 of the four clusters are included. Note that at least one mutation must occur on the root edges of clusters 1−3 (marked as an x in boldface type). Mutations on the root edge of cluster 4 may or may not occur (x in regular type). The time of origin tor and the two oldest branching times t1, t2 are marked; the 3rd through 12th branching times are not marked for easier readability.
F<sc>igure</sc> 2.—
Figure 2.—
Posterior distribution of the transmission rate λ (unit: per year), the net transmission rate λ − μ (unit: per year) and reproductive value λ/μ for tuberculosis allele frequency data obtained through MCMC chains with different starting values. The numbers below each histogram are the median and those in brackets are the lower and upper 95% credible intervals.

Similar articles

Cited by

References

    1. Amundsen E., Stigum H., Roettingen J., Aalen O., 2004. Definition and estimation of an actual reproduction number describing past infectious disease transmission: application to HIV epidemics among homosexual men in Denmark, Norway and Sweden. Epidemiol. Infect. 132: 1139–1149 - PMC - PubMed
    1. Anderson R., May R., 1979. Population biology of infectious diseases: Part I. Nature 280: 361–367 - PubMed
    1. Anderson R., May R., 1992. Infectious Diseases of Humans: Dynamics and Control. Oxford University Press, New York
    1. Beaumont M., Zhang W., Balding D., 2002. Approximate Bayesian computation in population genetics. Genetics 162: 2025. - PMC - PubMed
    1. Ewens W., 1972. The sampling theory of selectively neutral alleles. Theor. Popul. Biol. 3: 87–112 - PubMed