. 2011 Jul 1;71(13):4423-31.
doi: 10.1158/0008-5472.CAN-10-4157. Epub 2011 May 5.

Tumor galectin-1 mediates tumor growth and metastasis through regulation of T-cell apoptosis

Affiliations

Tumor galectin-1 mediates tumor growth and metastasis through regulation of T-cell apoptosis

Alice Banh et al. Cancer Res. .

Abstract

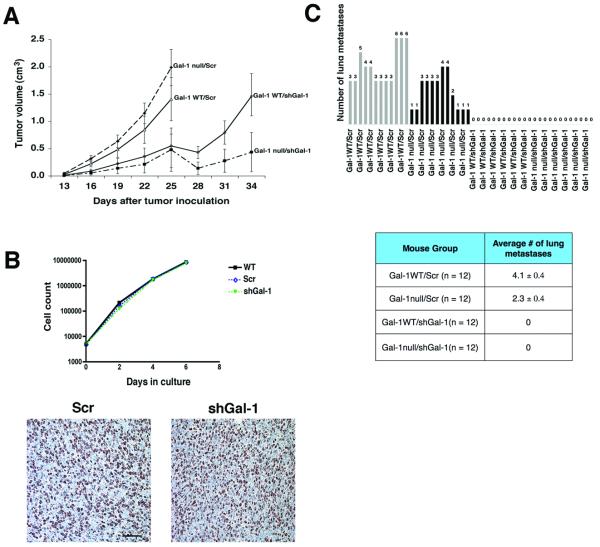
Galectin-1 (Gal-1), a carbohydrate-binding protein whose secretion is enhanced by hypoxia, promotes tumor aggressiveness by promoting angiogenesis and T-cell apoptosis. However, the importance of tumor versus host Gal-1 in tumor progression is undefined. Here we offer evidence that implicates tumor Gal-1 and its modulation of T-cell immunity in progression. Comparing Gal-1-deficient mice as hosts for Lewis lung carcinoma cells where Gal-1 levels were preserved or knocked down, we found that tumor Gal-1 was more critical than host Gal-1 in promoting tumor growth and spontaneous metastasis. Enhanced growth and metastasis associated with Gal-1 related to its immunomodulatory function, insofar as the benefits of Gal-1 expression to Lewis lung carcinoma growth were abolished in immunodeficient mice. In contrast, angiogenesis, as assessed by microvessel density count, was similar between tumors with divergent Gal-1 levels when examined at a comparable size. Our findings establish that tumor rather than host Gal-1 is responsible for mediating tumor progression through intratumoral immunomodulation, with broad implications in developing novel targeting strategies for Gal-1 in cancer.


Figures

Figure 1
Figure 1. Silencing Gal-1 expression in LLC cells delayed tumor growth and metastasis
Panel A: Average tumor volume over time for the 4 different groups of mice. The shGal-1 tumors were significantly smaller compared to Scr tumors regardless of mouse phenotype (p = 0.01). Tumor growth was impaired when mice (WT and Gal-1 null mice) were inoculated with shGal-1 cells. The Scr tumors in WT and Gal-1 null mice showed similar growth rate. Panel B upper: In-vitro growth curves showing similar growth rate between WT (wild-type parental), Scr and shGal-1 tumors. Panel B lower: Ki67 staining (200x magnification; scale bar = 100 μm) showing similar number of Ki-67 positive cells in excised Scr and shGal-1 tumors. Panel C: the upper graph shows the absolute number of spontaneous lung metastasis quantified with light microscopy. The lower table shows the average number of lung metastases/section for each mouse group. Note that Gal-l WT/Scr mice had the highest number of lung metastases (n = 12, 4.1 ± 0.4 mets/lung section) followed by Gal-1 null/Scr mice (n = 12, 2.3 ± 0.4 mets/lung section). None of the mice with shGal-1 tumors developed spontaneous lung metastasis (Gal-1 WT and Gal-1 null: n = 12, 0 ± 0 mets/lung section).
Figure 2
Figure 2. The effects of Gal-1 on tumor growth and metastasis are eliminated in immuno-compromised mouse models
Panel A: The average tumor volume over time of Scr and shGal-1 tumors grown in Nod.Cg-Prkdcscid IL2rgtm1Wjl/SzJ (Nod-Scid; n = 15), B6.Cg-Foxn1nu/J (T cell−/−; n = 15) and B6.129S2-Ign-6tm1Cgn/J (B cell−/−; n = 15) mice. Note the growth rate was similar for both tumor types. Panel B: Average number of spontaneous lung metastases for Scr (n = 5) and shGal-1 (n = 7) in Nod-Scid mice. The mice inoculated with Scr (19.8 ± 3.8 mets/lung section) and shGal-1 (17.4 ± 2.8 mets/lung section) tumors show similar number of lung metastasis.
Figure 3
Figure 3. Silencing Gal-1 expression in tumor cells enhanced lymphocyte survival
Panel A: CD3 staining (DAB detection, 200x magnification, scale bar = 50 μm) demonstrated greater intratumoral lymphocytes in the shGal-1 tumors than the Scr tumors grown in the Gal-1 WT host. Staining of mouse lymph nodes is used as a positive control. Panel B: colocalization of CD4 and CD8 (red) with TUNEL (green) was performed on Gal-1 WT mouse tumors (400x magnification, scale bar = 50 μm). Cell nucleus is labeled with DAPI (blue). The greatest amount of CD8 cell death is found in the Scr tumors (n = 4, 61.2 ± 8.3%) when compared to the shGal-1 tumors (n = 4, 15.3 ± 4.6%). Similarly, CD4 T-cell death in the Scr tumors (n = 4, 46.2± 7.5%) is greater than the shGal-1 tumors (n = 4, 3.9 ± 1.5%).
Figure 4
Figure 4. Pro-angiogenic effect of Gal-1 is related to the tumor volume
Panel A: Quantification of microvessel density count (MVD) based on CD31 staining were performed on WT mouse tumor tissues (200x magnification, scale = 100 μm). The graph shows the timepoints when tumors were collected to examine for MVD. The MVD was examined at 22 days after tumor implantation when tumor volume between the Scr and shGal-1 tumors showed the largest difference (panels A I and B I). At 22 days post-implantation, the MVD was significantly reduced in the shGal-1 tumor (n = 3, 34.0 ± 4.6 microvessels/mm2; tumor volume: 0.35 ± 0.15 cm3) when compared to the Scr tumors (n = 3, 62.0 ± 5.7 microvessels/mm2, tumor volume: 0.85 ± 0.25 cm3). The MVD of tumors at collected at >25 days after tumor implantation when tumor volume was comparable between the two groups was also examined (panels A II and B II). There was no difference in MVD between the Scr (n = 3, 40.1 ± 2.6 microvessels/mm2, tumor volume: 1.80 ± 0.25 cm3) and shGal-1 (n = 3, 40.9± 2.9 microvessels/mm2, tumor volume: 1.46 ± 0.42 cm3) tumors. Finally, the MVD of Scr tumors collected when the tumor volume (0.36 ± 0.08 cm3, < 22 days) was comparable to that of shGal-1 tumor at day 22 was examined (panels A III and B III). The MVD of the smaller Scr tumors (n = 3, 33.5 ± 1.6 microvessels/mm2) is simlar to the MVD of shGal-1 at day 22 post implantation (34.0 ± 4.6 microvessels/mm2). Panel C: quantification of MVD in Scr and shGal-1 tumors grown in B cell−/− and T-cell−/− mice showed no significant difference between the Scr and shGal-1 tumors. The average MVD for Scr in the B cell−/− host (n = 3, 43.3 ± 2.1 microvessels/mm2) and T-cell−/− host (n = 3, 22.8 ± 1.3 microvessels/mm2) did not differ from their respective shGal-1 tumors in the B cell−/− host (n = 3, 37.7 ± 3.7 microvessels/mm2) and T-cell−/− host (n = 3, 23.9 ± 1.0 microvessels/mm2).

Similar articles

Cited by

References

    1. Rabinovich GA, Ilarregui JM. Conveying glycan information into T-cell homeostatic programs: a challenging role for galectin-1 in inflammatory and tumor microenvironments. Immunol Rev. 2009;230:144–59. - PubMed
    1. Liu FT, Rabinovich GA. Galectins as modulators of tumour progression. Nat Rev Cancer. 2005;5:29–41. - PubMed
    1. Rabinovich GA, Baum LG, Tinari N, et al. Galectins and their ligands: amplifiers, silencers or tuners of the inflammatory response? Trends Immunol. 2002;23:313–20. - PubMed
    1. Barondes SH, Castronovo V, Cooper DN, et al. Galectins: a family of animal beta-galactoside-binding lectins. Cell. 1994;76:597–8. - PubMed
    1. Cleves AE, Cooper DN, Barondes SH, et al. A new pathway for protein export in Saccharomyces cerevisiae. J Cell Biol. 1996;133:1017–26. - PMC - PubMed

Publication types

MeSH terms