. 2011 Nov;18(11):1711-25.
doi: 10.1038/cdd.2011.47. Epub 2011 May 6.

Pro-apoptotic activity of inhibitory PAS domain protein (IPAS), a negative regulator of HIF-1, through binding to pro-survival Bcl-2 family proteins

Affiliations

Pro-apoptotic activity of inhibitory PAS domain protein (IPAS), a negative regulator of HIF-1, through binding to pro-survival Bcl-2 family proteins

S Torii et al. Cell Death Differ. 2011 Nov.

Abstract

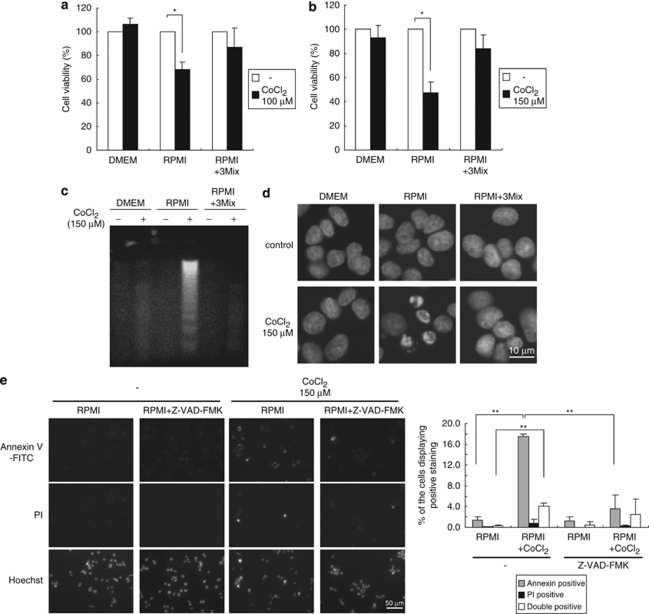
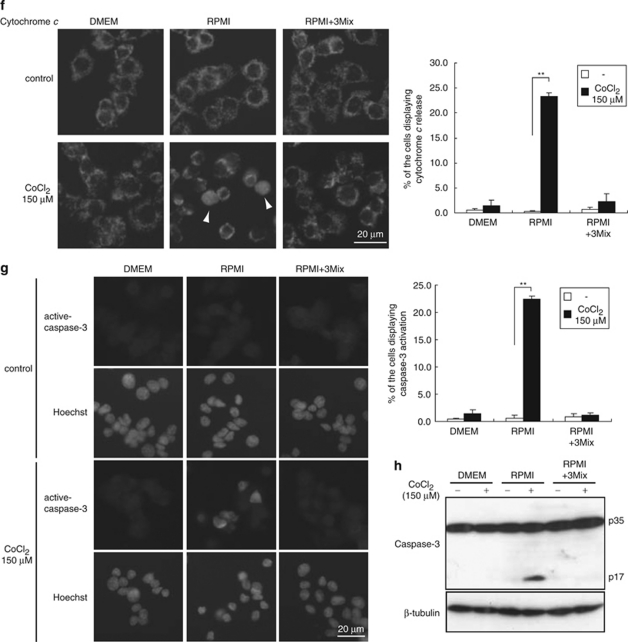
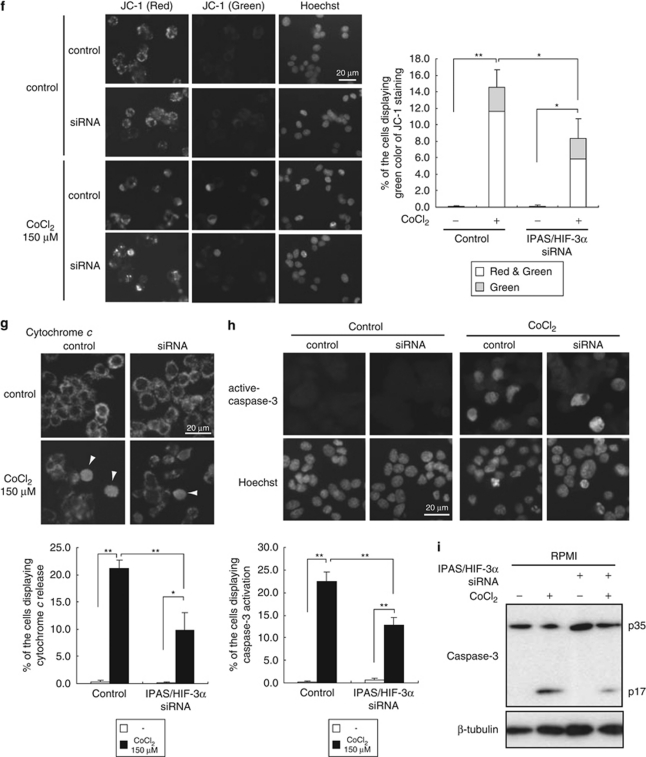
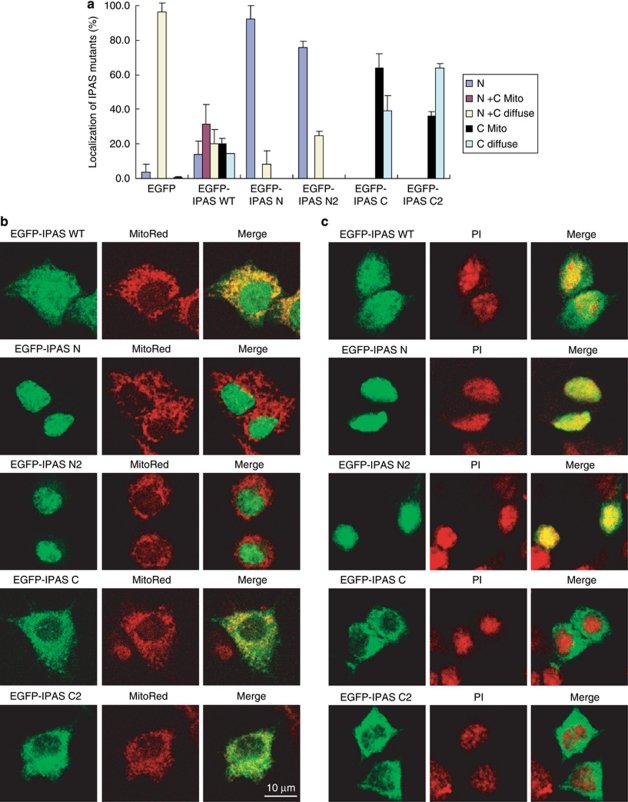
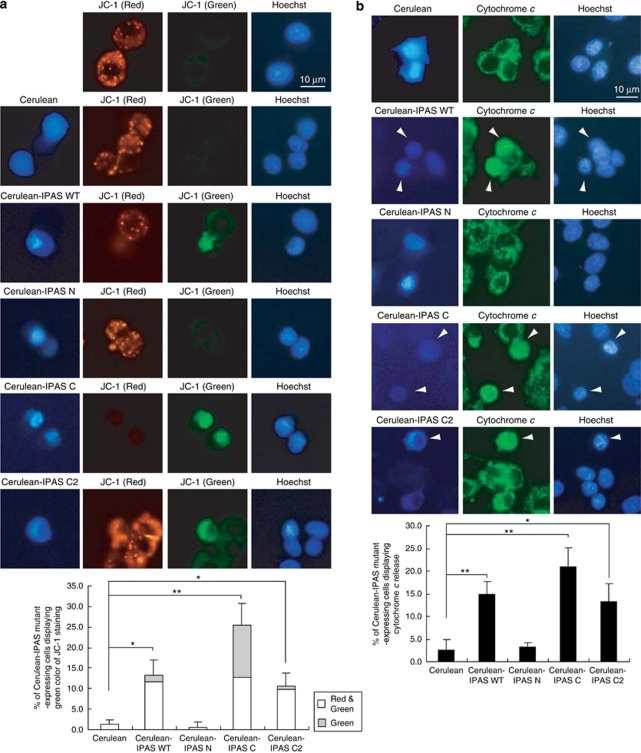
Inhibitory PAS (Per/Arnt/Sim) domain protein (IPAS) is a dominant negative transcription factor that represses hypoxia-inducible factor 1 (HIF-1) activity. In this study, we show that IPAS also functions as a pro-apoptotic protein through binding to pro-survival Bcl-2 family members. In a previous paper, we reported that NF-κB-dependent IPAS induction by cobalt chloride repressed the hypoxic response in PC12 cells. We found that prolonged incubation under the same conditions caused apoptosis in PC12 cells. Repression of IPAS induction protected cells from apoptosis. Furthermore, knockdown of IPAS recovered cell viability. EGFP-IPAS protein was localized in both the nucleus and the cytoplasm, with a large fraction associated with mitochondria. Mitochondrial IPAS induced mitochondria depolarization and caspase-3 activation. Immunoprecipitation assays revealed that IPAS is associated with Bcl-x(L), Bcl-w and Mcl-1. The association of IPAS with Bcl-x(L) was also observed in living cells by the FLIM-based FRET analysis, indicating direct binding between the two proteins. IPAS contributed to dysfunction of Bcl-x(L) by inhibiting the interaction of Bcl-x(L) with Bax. These results demonstrate that IPAS functions as a dual function protein involved in transcription repression and apoptosis.


Figures

Figure 1
Figure 1
Cell apoptosis induced by CoCl2 in RPMI-cultured PC12 cells. (a and b) Cell viability was assayed by trypan blue dye exclusion. Cells were incubated in the indicated medium for 24 h with 100 μM (a) or 150 μM (b) CoCl2. 3Mix indicates a mixture of magnesium, histidine and threonine, giving equivalent concentrations to those included in DMEM. (c) CoCl2-induced DNA fragmentation in RPMI-cultured PC12 cells. DNA was prepared from PC12 cells treated with 150 μM CoCl2 for 16 h. (d) CoCl2-induced chromatin condensation in RPMI-cultured PC12 cells. Cells were treated with or without 150 μM CoCl2 for 16 h, and stained with Hoechst 33342. (e) Annexin V/PI staining of RPMI-cultured PC12 cells. Cells were treated with or without 150 μM CoCl2 in the presence of 20 μM Z-VAD-FMK for 16 h, and stained with Annexin V-FITC and PI (left). Quantification of apoptotic and necrotic cells is expressed as the percentage of the cells displaying Annexin V and Annexin V/PI-double staining, respectively. A minimum of 700 cells per sample was counted and the percentage of cells with respective staining patterns was shown in a bar graph (right). (f) Cytochrome c staining of PC12 cells. Cells were incubated in the indicated medium for 16 h with or without 150 μM CoCl2. A minimum of 400 cells per sample was counted. Arrowheads: cells with release of cytochrome c. (g) Active caspase-3 staining of PC12 cells. Cells were incubated in the indicated medium for 16 h with or without 150 μM CoCl2. A minimum of 400 cells per sample was counted. (h) Immunoblot analysis of active caspase-3. Cells were incubated in the indicated medium for 16 h with or without 150 μM CoCl2. Cell lysates were analyzed by immunoblotting for the cleavage of caspase-3. Data shown in bar graphs are averages±S.D. of three independent experiments. *P<0.05 for indicated comparison. **P<0.01 for indicated comparison
Figure 1
Figure 1
Cell apoptosis induced by CoCl2 in RPMI-cultured PC12 cells. (a and b) Cell viability was assayed by trypan blue dye exclusion. Cells were incubated in the indicated medium for 24 h with 100 μM (a) or 150 μM (b) CoCl2. 3Mix indicates a mixture of magnesium, histidine and threonine, giving equivalent concentrations to those included in DMEM. (c) CoCl2-induced DNA fragmentation in RPMI-cultured PC12 cells. DNA was prepared from PC12 cells treated with 150 μM CoCl2 for 16 h. (d) CoCl2-induced chromatin condensation in RPMI-cultured PC12 cells. Cells were treated with or without 150 μM CoCl2 for 16 h, and stained with Hoechst 33342. (e) Annexin V/PI staining of RPMI-cultured PC12 cells. Cells were treated with or without 150 μM CoCl2 in the presence of 20 μM Z-VAD-FMK for 16 h, and stained with Annexin V-FITC and PI (left). Quantification of apoptotic and necrotic cells is expressed as the percentage of the cells displaying Annexin V and Annexin V/PI-double staining, respectively. A minimum of 700 cells per sample was counted and the percentage of cells with respective staining patterns was shown in a bar graph (right). (f) Cytochrome c staining of PC12 cells. Cells were incubated in the indicated medium for 16 h with or without 150 μM CoCl2. A minimum of 400 cells per sample was counted. Arrowheads: cells with release of cytochrome c. (g) Active caspase-3 staining of PC12 cells. Cells were incubated in the indicated medium for 16 h with or without 150 μM CoCl2. A minimum of 400 cells per sample was counted. (h) Immunoblot analysis of active caspase-3. Cells were incubated in the indicated medium for 16 h with or without 150 μM CoCl2. Cell lysates were analyzed by immunoblotting for the cleavage of caspase-3. Data shown in bar graphs are averages±S.D. of three independent experiments. *P<0.05 for indicated comparison. **P<0.01 for indicated comparison
Figure 2
Figure 2
Induction of IPAS by CoCl2 in RPMI-cultured PC12 cells and its involvement in CoCl2-induced apoptosis. (a) Time dependence of IPAS mRNA expression in CoCl2-treated PC12 cells cultured in different media. IPAS mRNA expression levels in PC12 cells treated with CoCl2 for 6 h (left) and 10 h (right) were determined by RT-PCR. PCR products were analyzed on 1% agarose gels. 18 S rRNA was used as a control. Data shown are representative of three independent experiments. (b) Decrease in IPAS expression by siRNA treatment. GFP siRNA was used as a control. Data were normalized to 18 S rRNA and the value of cells treated with CoCl2 in the presence of GFP siRNA was set to 1. (c) Decrease in overexpressed IPAS by siRNA treatment. PC12 cells were transfected with a plasmid for Myc-tagged mouse IPAS and treated with GFP siRNA or IPAS/HIF-3α siRNA for 24 h. Cell lysates were analyzed by immunoblot. β-tubulin was used as a control. (d) Cell viability recovered by the treatment with IPAS/HIF-3α siRNA in RPMI-cultured PC12 cells. PC12 cells were transfected with siRNA for 24 h, and incubated in indicated medium in the presence or absence of 150 μM CoCl2 for 24 h. GFP siRNA was used as a control. *P<0.05 for indicated comparison. Data shown in bar graphs are averages±S.D. of three independent experiments. (e) Decrease in CoCl2-induced DNA fragmentation by the treatment with IPAS/HIF-3α siRNA. PC12 cells were transfected with siRNA for 24 h and then incubated in indicated medium in the presence or absence of 150 μM CoCl2 for 16 h. Data shown are representative of three independent experiments. (f) Decrease in CoCl2-dependent mitochondrial depolarization by IPAS/HIF-3α siRNA treatment. PC12 cells were transfected with indicated siRNA and incubated with or without CoCl2 for 16 h and stained with JC-1 for 20 min. After washing with RPMI, the cells were observed using a fluorescence microscope. (g) Decrease in cytochrome c release by IPAS/HIF-3α siRNA treatment. siRNA-transfected cells were incubated in RPMI with or without 150 μM CoCl2 in the presence of Z-VAD-FMK for 16 h. A minimum of 400 cells per sample was counted. Arrowheads show the cells with release of cytochrome c. (h and i) Decrease in activation of caspase-3 by IPAS/HIF-3α siRNA treatment. siRNA-transfected cells were incubated in RPMI with or without 150 μM CoCl2 for 16 h. A minimum of 400 cells per sample was counted (h). Cell lysates were analyzed by immunoblotting for the cleavage of caspase-3 (i). Data shown in bar graphs are averages±S.D. of three independent experiments. *P<0.05 for indicated comparison. **P<0.01 for indicated comparison
Figure 2
Figure 2
Induction of IPAS by CoCl2 in RPMI-cultured PC12 cells and its involvement in CoCl2-induced apoptosis. (a) Time dependence of IPAS mRNA expression in CoCl2-treated PC12 cells cultured in different media. IPAS mRNA expression levels in PC12 cells treated with CoCl2 for 6 h (left) and 10 h (right) were determined by RT-PCR. PCR products were analyzed on 1% agarose gels. 18 S rRNA was used as a control. Data shown are representative of three independent experiments. (b) Decrease in IPAS expression by siRNA treatment. GFP siRNA was used as a control. Data were normalized to 18 S rRNA and the value of cells treated with CoCl2 in the presence of GFP siRNA was set to 1. (c) Decrease in overexpressed IPAS by siRNA treatment. PC12 cells were transfected with a plasmid for Myc-tagged mouse IPAS and treated with GFP siRNA or IPAS/HIF-3α siRNA for 24 h. Cell lysates were analyzed by immunoblot. β-tubulin was used as a control. (d) Cell viability recovered by the treatment with IPAS/HIF-3α siRNA in RPMI-cultured PC12 cells. PC12 cells were transfected with siRNA for 24 h, and incubated in indicated medium in the presence or absence of 150 μM CoCl2 for 24 h. GFP siRNA was used as a control. *P<0.05 for indicated comparison. Data shown in bar graphs are averages±S.D. of three independent experiments. (e) Decrease in CoCl2-induced DNA fragmentation by the treatment with IPAS/HIF-3α siRNA. PC12 cells were transfected with siRNA for 24 h and then incubated in indicated medium in the presence or absence of 150 μM CoCl2 for 16 h. Data shown are representative of three independent experiments. (f) Decrease in CoCl2-dependent mitochondrial depolarization by IPAS/HIF-3α siRNA treatment. PC12 cells were transfected with indicated siRNA and incubated with or without CoCl2 for 16 h and stained with JC-1 for 20 min. After washing with RPMI, the cells were observed using a fluorescence microscope. (g) Decrease in cytochrome c release by IPAS/HIF-3α siRNA treatment. siRNA-transfected cells were incubated in RPMI with or without 150 μM CoCl2 in the presence of Z-VAD-FMK for 16 h. A minimum of 400 cells per sample was counted. Arrowheads show the cells with release of cytochrome c. (h and i) Decrease in activation of caspase-3 by IPAS/HIF-3α siRNA treatment. siRNA-transfected cells were incubated in RPMI with or without 150 μM CoCl2 for 16 h. A minimum of 400 cells per sample was counted (h). Cell lysates were analyzed by immunoblotting for the cleavage of caspase-3 (i). Data shown in bar graphs are averages±S.D. of three independent experiments. *P<0.05 for indicated comparison. **P<0.01 for indicated comparison
Figure 3
Figure 3
Induction of mitochondria clustering and nuclear condensation due to IPAS expression. (a) Schematic representation of the N- and C-terminal regions of IPAS used for plasmid construction. bHLH: basic helix-loop-helix domain; PAS: Per/Arnt/Sim domain. (b) Induction of chromatin condensation in DMEM-cultured PC12 cells with expression of IPAS WT, IPAS C and IPAS C2. PC12 cells were transfected with pEGFP–IPAS constructs, stained with MitoRed and Hoechst 33342 and observed using a fluorescence microscope. Two representative images of cells expressing IPAS WT, C and C2 were shown. Arrowheads show the cells with mitochondrial localization of IPAS, mitochondria clustering and chromatin condensation. (c) Quantification of cell death is expressed as the percentage of cells displaying nuclear condensation. Cells were transfected and stained as shown in (b). A minimum of 100 cells per sample was counted. Data shown in the bar graph are averages±S.D. of three independent experiments. **P<0.01 for indicated comparison
Figure 4
Figure 4
Subcellular localization of IPAS WT and its deletion mutants in PC12 cells. (a) PC12 cells were transfected with pEGFP–IPAS constructs, incubated with Z-VAD-FMK, stained with MitoRed and counted the percentage of cells showing different localization of IPAS mutants. Data shown in the bar graphs are averages±S.D. of three independent experiments. N, Nucleus; C, cytoplasm; Mito, mitochondria. (b and c) PC12 cells were transfected with pEGFP–IPAS construct, incubated with Z-VAD-FMK, stained with MitoRed (b) or PI (c) and observed using a confocal fluorescence microscope
Figure 5
Figure 5
Induction of mitochondrial depolarization and release of cytochrome c by IPAS WT and its deletion mutants in PC12 cells. (a) Mitochondrial depolarization in DMEM-cultured PC12 cells induced by IPAS WT, IPAS C and IPAS C2. PC12 cells were transfected with pCerulean-IPAS constructs in the presence of Z-VAD-FMK and stained with JC-1 for 20 min. After washing with DMEM, the cells were observed using a fluorescence microscope. A minimum of 100 transfected cells with different staining patterns per sample was counted and the result is shown below. (b) Release of cytochrome c in DMEM-cultured PC12 cells induced by IPAS WT, IPAS C and IPAS C2. PC12 cells were transfected with pCerulean–IPAS constructs in the presence of Z-VAD-FMK and stained using an anti-cytochrome c antibody. A minimum of 100 cells with different staining patterns per sample was counted and the result is shown below. Data shown in bar graphs are averages±S.D. of three independent experiments. *P<0.05 for indicated comparison. **P<0.01 for indicated comparison
Figure 6
Figure 6
Activation of caspase-3 by IPAS WT, IPAS C and IPAS C2. PC12 cells were transfected with pEGFP–IPAS constructs and stained with active-caspase-3 antibody and Hoechst 33342. A minimum of 100 transfected cells showing different staining patterns per sample was counted and the result is shown below. Data shown in bar graphs are averages±S.D. of three independent experiments. **P<0.01 for indicated comparison
Figure 7
Figure 7
Binding of IPAS to pro-survival Bcl-2 family members through its C-terminal region. (a) Binding of IPAS to Bcl-xL but not to Bcl-2 and Bax. HEK293T cells were transfected with indicated combinations of expression plasmids and analyzed by immunoprecipitation with antibody against FLAG followed by immunoblotting with antibody against Myc. (b and c) Binding of IPAS to endogenous Bcl-xL but not to Bcl-2 and Bax. HEK293T cells were transfected with pBOS–3Myc–IPAS, incubated in the presence of Z-VAD-FMK and cell lysates were analyzed by immunoprecipitation with antibodies against rabbit IgG (Con.), Bcl-2, Bcl-xL and Bax followed by immunoblotting with antibody against Myc (b), or analyzed by immunoprecipitation with an antibody against Myc followed by immunoblotting with antibodies against Bcl-2, Bcl-xL and Bax (c). (d) Binding of IPAS to pro-survival Bcl-2 family members. Assays were carried out as in (a). (e) Binding of IPAS to Bcl-xL through its C-terminal region. Assays were carried out as in (a). (f) Subcellular localization of IPAS and Bcl-xL in HEK293T cells. HEK293T cells were transfected with pEGFP–IPAS constructs together with pBOS–3Myc–Bcl-xL plasmid, stained with antibody against Myc and observed using a confocal fluorescence microscope. (g) FLIM-FRET analysis of the interaction between IPAS-Cerulean (IC) and Bcl-xL-Citrine (BY) (left) and between IPAS C-Cerulean (ICC) and Bcl-xL-Citrine (right) in living CHO-K1 cells. CHO-K1 cells were transfected with indicated combinations of expression plasmids. The fluorescence decay curves of Cerulean (blue) represent an average of fluorescence decay data obtained from the cytoplasmic area of the observed cells. The decay curve of separately expressed IPAS-Cerulean or IPAS C-Cerulean (shown in black) was also shown. The shapes of the recorded instrumental response function (IRF) are shown in red. Data shown are representative of three independent experiments (top). FLIM images in the presence (IC+BY) or (ICC+BY) or absence (IC) or (ICC) of Bcl-xL-Citrine. Lifetime maps were made from TSCSPC data by fitting data to a single exponential decay. In the FLIM map, color corresponds to the fluorescence lifetime indicated by a false color scale (bottom). (h) Fluorescence decay data for IPAS-Cerulean or IPAS C-Cerulean in the presence or absence of Bcl-xL-Citrine in living CHO-K1 cells. a1 and a2 are the exponential coefficients for the τ1 and τ2 decay times, respectively. n: number of cells examined. The differences between the two τ1 values and the two τ2 values in the both case of IPAS WT and IPAS C were significant (P<0.001)
Figure 8
Figure 8
Inhibition of the Bcl-xL/Bax complex formation by IPAS. (a) Inhibition of interaction between Bcl-xL and Bax by IPAS. HEK293T cells were transfected with indicated combinations of expression plasmids, incubated in the presence of Z-VAD-FMK and analyzed by immunoprecipitation with antibody against FLAG followed by immunoblotting with antibody against HA. Immunoprecipitated HA-Bax was normalized to total HA-Bax in the lysates in each lane and the result is shown below. (b) Western blot analysis of subcellular localization of endogenous Bax in PC12 cells. Cells were treated with CoCl2 for indicated times and separated into cytosolic and membrane fractions, followed by immunoblotting with indicated antibodies. Bcl-xL and GAPDH were controls for cytosol and mitochondrial localization, respectively. (c) Inhibition of dissociation of the Bcl-xL/Bax complex by IPAS/HIF-3α siRNA treatment. PC12 cells were transfected with GFP or IPAS/HIF-3α siRNA and incubated with or without CoCl2 in the presence of Z-VAD-FMK for 16 h, and cell lysates were analyzed by immunoprecipitation with antibody against Bcl-xL followed by immunoblotting with antibody against Bax. (d) Inhibition of IPAS-induced activation of caspase-3 by Bcl-2 family members. PC12 cells were transfected with pCerulean, pCerulean-IPAS, pCerulean-IPAS+pBOS-3MycBcl-xL and pCerulean-IPAS+pBOS-3MycBcl-2, respectively, stained with active-caspase-3 antibody and Hoechst 33342 and observed using a fluorescence microscope. A minimum of 100 transfected cells with or without active caspase-3 staining per sample was counted and the result is shown at right. Data shown in bar graphs are averages±S.D. of three independent experiments. *P<0.05 for indicated comparison. **P<0.01 for indicated comparison. (e) A model for the action of IPAS in apoptosis. IPAS is bound to Bcl-xL and some other pro-survival Bcl-2 members on mitochondria and blocks the interaction of Bcl-xL with Bax, thus activating the pro-apoptotic function of Bax, followed by release of cytochrome c and activation of caspase-3. IPAS functions as a dual function protein involved in transcription repression of HIF-1α and apoptosis

Similar articles

Cited by

References

    1. Hirota K, Semenza GL. Regulation of hypoxia-inducible factor 1 by prolyl and asparaginyl hydroxylases. Biochem Biophys Res Commun. 2005;338:610–616. - PubMed
    1. Kaelin WG., Jr The von Hippel-Lindau protein, HIF hydroxylation, and oxygen sensing. Biochem Biophys Res Commun. 2005;338:627–638. - PubMed
    1. Schofield CJ, Ratcliffe PJ. Signalling hypoxia by HIF hydroxylases. Biochem Biophys Res Commun. 2005;338:617–626. - PubMed
    1. Makino Y, Cao R, Svensson K, Bertilsson G, Asman M, Tanaka H, et al. Inhibitory PAS domain protein is a negative regulator of hypoxia-inducible gene expression. Nature. 2001;414:550–554. - PubMed
    1. Makino Y, Uenishi R, Okamoto K, Isoe T, Hosono O, Tanaka H, et al. Transcriptional up-regulation of inhibitory PAS domain protein gene expression by hypoxia-inducible factor 1 (HIF-1): a negative feedback regulatory circuit in HIF-1-mediated signaling in hypoxic cells. J Biol Chem. 2007;282:14073–14082. - PubMed

MeSH terms