. 2011 May;95(3):271-87.
doi: 10.1901/jeab.2011.95-271.

Resurgence of temporal patterns of responding

Affiliations

Resurgence of temporal patterns of responding

Carlos R X Cançado et al. J Exp Anal Behav. 2011 May.

Abstract

The resurgence of temporal patterns of key pecking by pigeons was investigated in two experiments. In Experiment 1, positively accelerated and linear patterns of responding were established on one key under a discrete-trial multiple fixed-interval variable-interval schedule. Subsequently, only responses on a second key produced reinforcers according to a variable-interval schedule. When reinforcement on the second key was discontinued, positively accelerated and linear response patterns resurged on the first key, in the presence of the stimuli previously correlated with the fixed- and variable-interval schedules, respectively. In Experiment 2, resurgence was assessed after temporal patterns were directly reinforced. Initially, responding was reinforced if it approximated an algorithm-defined temporal pattern during trials. Subsequently, reinforcement depended on pausing during trials and, when it was discontinued, resurgence of previously reinforced patterns occurred for each pigeon and for 2 of 3 pigeons during a replication. The results of both experiments demonstrate the resurgence of temporally organized responding and replicate and extend previous findings on resurgence of discrete responses and spatial response sequences.

Keywords: behavioral history; discrete-trial procedure; key peck; pigeons; resurgence; temporal patterns of responding.


Figures
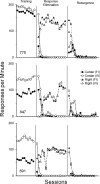
Fig 1
Fig 1
Responses per minute during each schedule component for the last 10 sessions of the Training phase and all sessions of the Response-Elimination and Resurgence phases of Experiment 1.
Fig 2
Fig 2
Cumulative response distributions in 0.25-s bins for each pigeon in Experiment 1. Each graph shows, from upper to lower diagonal, distributions for the last six sessions of the Training and Response Elimination phases, and all sessions of the Resurgence phase during FI (black) and VI (gray) schedule components. Phases are separated by white lines in the horizontal plane on each graph.
Fig 3
Fig 3
Cumulative response distributions in 0.25-s bins for each pigeon in Experiment 1. Each graph shows, from upper to lower diagonal, distributions for all sessions of the Resurgence phase. Other details as in Figure 2.
Fig 4
Fig 4
Relative frequency distributions of cumulative responses in 0.25-s bins, for each pigeon in Experiment 1. Left and right graphs show relative frequency distributions in the FI and VI components, respectively, for the last session of the Training phase (gray circles) and for each of the first five sessions of the Resurgence phase (R1 through R5). Distributions were generated for each component by dividing the number of responses in each bin by the total number of responses.
Fig 5
Fig 5
Median latency (in seconds) to the occurrence of the first center-key response within a trial, during each schedule component. Latencies are shown for the last 10 sessions of the Training phase and the first 10 sessions of the Resurgence phase of Experiment 1. Error bars extend from the 25th to the 75th percentile. Missing data, for either component, reflect sessions in which responding did not occur. Data points without error bars indicate sessions in which only one response occurred and, thus, represent the latency for the occurrence of that response.
Fig 6
Fig 6
Cumulative response distributions in 0.5-s bins for each pigeon during the first exposure (left graphs) and replication (right graphs) of each phase of Experiment 2. Each graph shows, from upper to lower diagonal, distributions for the last six sessions of the Training and Response Elimination phases, and the first 15 sessions of the Resurgence phase. Phases are separated by white lines in the horizontal plane on each graph.
Fig 7
Fig 7
Relative frequency distributions of cumulative responses in 0.5-s bins, for each pigeon in Experiment 2. Left and right graphs show relative frequency distributions in the first exposure and replication, respectively, for the last session of the Training phase (T; gray circles) and for each of the first five sessions of the Resurgence phase (R1 through R5). Other details as in Figure 5.
Fig 8
Fig 8
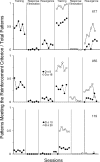
Proportion of patterns meeting the reinforcement criterion for the last six sessions of the Training and Response-Elimination phases, and the first six sessions of the Resurgence phases of Experiment 2. Closed and open circles represent, respectively, the proportion of patterns that met (i.e., during the Training phase) or would have met (i.e., during Response-Elimination and Resurgence phases) the requirements for reinforcement on the first exposure and replication of the Training phase. The closed circles connected by a dotted line represent the proportion of the patterns occurring on each phase during the replication of the procedure that would meet the reinforcement criterion under the contingencies in effect during the first Training phase.
Fig A1
Fig A1
Cumulative response distributions (hypothetical data) in 1-s subintervals of a 5-s trial, showing the pattern described by Hawkes and Shimp's (1975) model. Also shown are the deviations from this model that defined reinforcement contingencies for Pigeons 617 and 955 (upper graph) and Pigeon 119 (lower graph) during the first exposure and replication of each phase of Experiment 2.

Similar articles

Cited by

References

    1. Azrin N.H, Hutchinson R.R, Hake D.F. Extinction-induced aggression. Journal of the Experimental Analysis of Behavior. 1966;9:191–204. - PMC - PubMed
    1. Bachá-Mendez G, Reid A.K, Mendoza-Soylovna A. Resurgence of integrated behavioral units. Journal of the Experimental Analysis of Behavior. 2007;87:5–24. - PMC - PubMed
    1. Bruzek J.L, Thompson R, Peters L. Resurgence of infant caregiving responses. Journal of the Experimental Analysis of Behavior. 2009;92:327–344. - PMC - PubMed
    1. Carey J.P. Reinstatement of previously learned responses under conditions of extinction: A study of “regression” [Abstract] American Psychologist. 1951;6:284.
    1. Carey J.P. Reinstatement of learned responses under conditions of extinction: A study of regression. 1953. Unpublished doctoral dissertation, Columbia University.

Publication types

LinkOut - more resources