. 2011 May;95(3):289-304.
doi: 10.1901/jeab.2011.95-289.

The effects of session length on demand functions generated using FR schedules

Affiliations

The effects of session length on demand functions generated using FR schedules

T Mary Foster et al. J Exp Anal Behav. 2011 May.

Abstract

In comparing open and closed economies, researchers often arrange shorter sessions under the former condition than under the latter. Several studies indicate that session length per se can affect performance and there are some data that indicate that this variable can influence demand functions. To provide further data, the present study exposed domestic hens to series of increasing fixed-ratio schedules with the length of the open-economy sessions varied over 10, 40, 60, and 120 min. Session time affected the total-session response rates and pause lengths. The shortest session gave the greatest response rates and shortest pauses and the longest gave the lowest response rates and longest pauses. The total-session demand functions also changed with session length: The shortest session gave steeper initial slopes (i.e., the functions were more elastic at small ratios) and smaller rates of change of elasticity than the longest session. Response rates, pauses, and demand functions were, however, similar for equivalent periods of responding taken from within sessions of different overall lengths (e.g., total-session data for 10-min sessions and the data for the first 10 min of 120-min sessions). These findings suggest that differences in session length can confound the results of studies comparing open and closed economies when those economies are arranged in sessions that differ substantially in length, hence data for equivalent-length periods of responding, rather than total-session data, should be of primary interest under these conditions.

Keywords: behavioral economics; closed economy; demand functions; domestic hens; fixed-ratio schedule; open economy; session length.


Figures

Fig 1
Fig 1
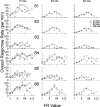
The overall response rates, calculated as the total number of responses divided by key time, averaged over the two series in each condition, plotted against the FR value (on a logarithmic x-axis) for each condition and each hen.
Fig 2
Fig 2
The mean PRP durations (total PRP time divided by the number of reinforcers obtained) averaged over the two series in each condition, plotted against the FR value (on a logarithmic x-axis) for each condition and each hen. There are three data points beyond the scale of this figure and their values are indicted in the top of the relevant graphs.
Fig 3
Fig 3
The running response rates (total number of responses divided by the total run time) averaged over the two series in each condition, plotted against the FR value (on a logarithmic x-axis) for each condition and each hen.
Fig 4
Fig 4
The natural logarithm of the average number of reinforcers obtained plotted against the natural logarithm of the FR value, averaged over the two series in each condition, for each condition and each hen. The functions shown were obtained by fitting Equation 1 to these data using curvilinear regression and the method of least squares.
Fig 5
Fig 5
The overall response rates from the first 10 min (left column), first 40 min (center column) and first 60 min (right column) of each session in Series 1 plotted against the FR value (on a logarithmic x-axis) for each hen. The different symbols indicate the total session durations.
Fig 6
Fig 6
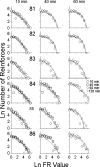
The natural logarithm of the average number of reinforcers obtained from the first 10 min (left column), first 40 min (center column) and first 60 min (right column) of each session in Series 1, plotted against the natural logarithm of the FR value for each hen. The different symbols indicate the total session durations. The functions shown were obtained by fitting Equation 1 to these data using curvilinear regression and the method of least squares.

Similar articles

Cited by

References

    1. Dougan J.D, Kuh J.A, Vink K.L. Session duration and the VI response function: Within-session prospective and retrospective effects. Journal of the Experimental Analysis of Behavior. 1993;60:543–557. - PMC - PubMed
    1. Ferster C.B, Skinner B.F. Schedules of reinforcement. New York: Appleton-Century-Crofts; 1957.
    1. Foltin R.W. Economic analysis of caloric alternatives and reinforcer magnitude on “demand” for food in baboons. Appetite. 1992;19:255–271. - PubMed
    1. Foltin R.W. Does package size matter? A unit price analysis of “demand” for food in baboons. Journal of the Experimental Analysis of Behavior. 1994;62:293–306. - PMC - PubMed
    1. Foster T.M, Blackman K.A, Temple W. Open versus closed economies: performance of domestic hens under fixed-ratio schedules. Journal of the Experimental Analysis of Behavior. 1997;67:67–89. - PMC - PubMed

LinkOut - more resources