. 2011 Apr 25;6(4):e19313.
doi: 10.1371/journal.pone.0019313.

Decreased bone formation and osteopenia in lamin a/c-deficient mice

Affiliations

Decreased bone formation and osteopenia in lamin a/c-deficient mice

Wei Li et al. PLoS One. .

Abstract

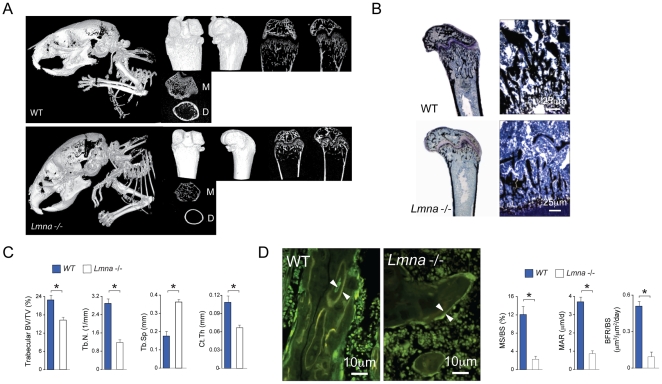
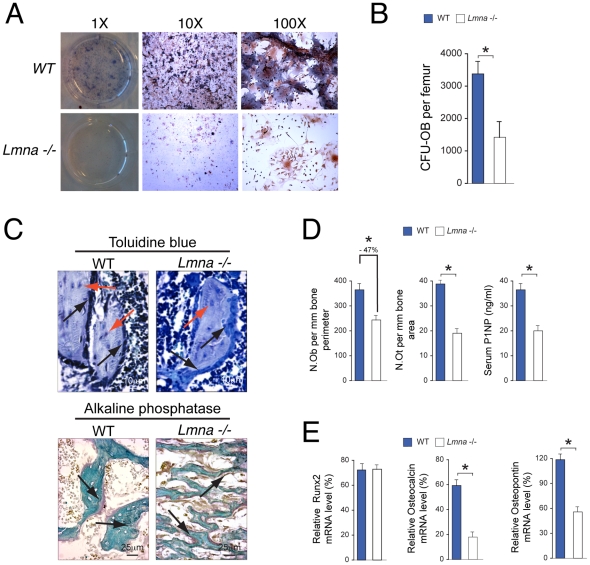
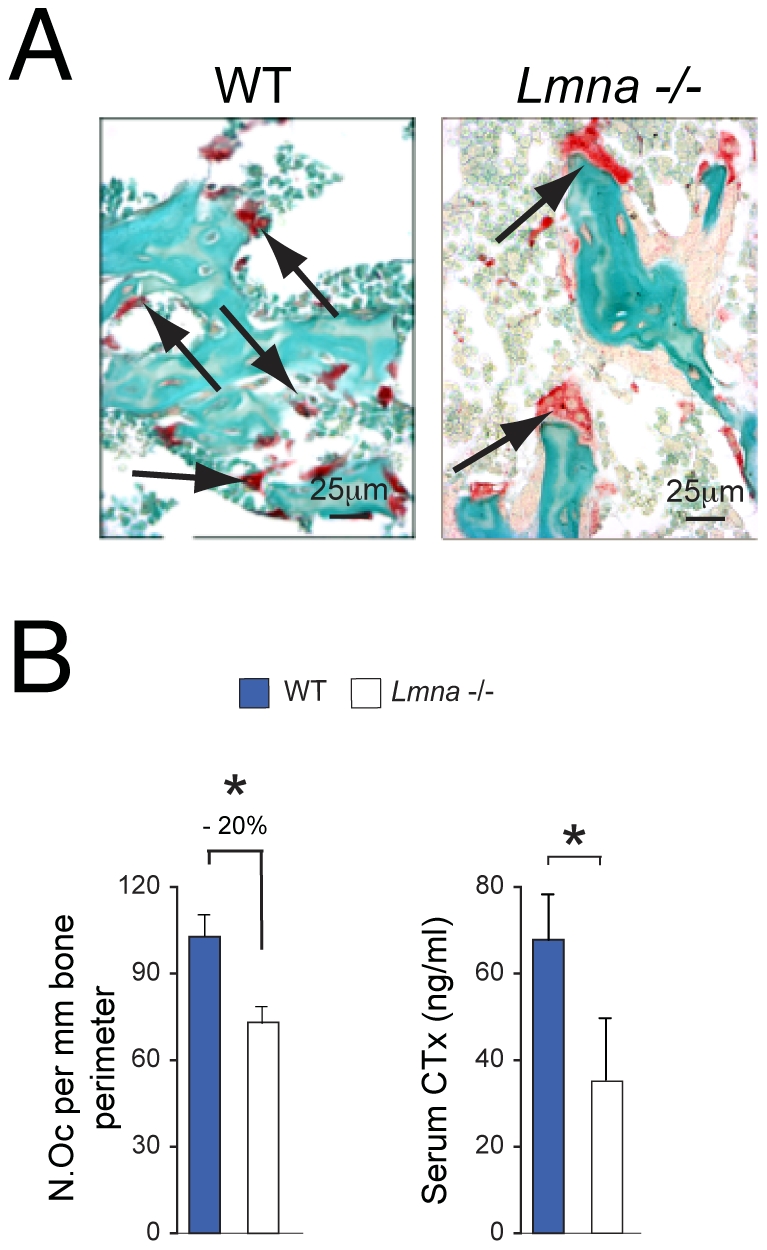
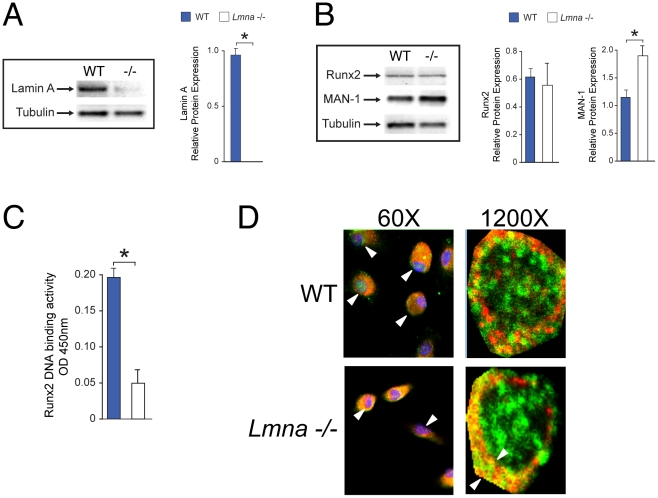
Age-related bone loss is associated with changes in bone cellularity with characteristically low levels of osteoblastogenesis. The mechanisms that explain these changes remain unclear. Although recent in vitro evidence has suggested a new role for proteins of the nuclear envelope in osteoblastogenesis, the role of these proteins in bone cells differentiation and bone metabolism in vivo remains unknown. In this study, we used the lamin A/C null (Lmna⁻/⁻) mice to identify the role of lamin A/C in bone turnover and bone structure in vivo. At three weeks of age, histological and micro computed tomography measurements of femurs in Lmna⁻/⁻ mice revealed a significant decrease in bone mass and microarchitecture in Lmna⁻/⁻ mice as compared with their wild type littermates. Furthermore, quantification of cell numbers after normalization with bone surface revealed a significant reduction in osteoblast and osteocyte numbers in Lmna⁻/⁻ mice compared with their WT littermates. In addition, Lmna⁻/⁻ mice have significantly lower osteoclast number, which show aberrant changes in their shape and size. Finally, mechanistic analysis demonstrated that absence of lamin A/C is associated with increase expression of MAN-1 a protein of the nuclear envelope closely regulated by lamin A/C, which also colocalizes with Runx2 thus affecting its capacity as osteogenic transcription factor. In summary, these data clearly indicate that the presence of lamin A/C is necessary for normal bone turnover in vivo and that absence of lamin A/C induces low bone turnover osteopenia resembling the cellular changes of age-related bone loss.


Conflict of interest statement

Competing Interests: The authors have declared that no competing interests exist.

Figures

Figure 1
Figure 1. Changes in bone architecture in Lmna −/− mice.
(A) Micro-CT analysis of total body (left panels) and femur of 4-week-old Lmna −/− mice and WT littermates. Images representative of two-and three- dimensional reconstructions, obtained with a 0.9° rotation between frames on a Skyscan® 1072 instrument, are shown for WT mice (A, upper panel) and Lmna −/− (A, lower panel) mice. Whole-body CT analysis of Lmna −/− mice and WT littermate controls shows dramatically lower bone accumulation in Lmna −/− mice with remarkable skull defects observed in the mutant mice. The right upper panels are representative of longitudinal sections. The lower right panels show the metaphysis (area just below the growth plate) (M) and distal diaphysis (cortical structure) (D). Lmna −/− mice exhibited profound thinning of cortical bone, a reduction in platelike structures and a lack of trabecular connectivity. These changes correlated with von Kossa staining (B). Quantitation of bone parameters (C) further exemplified a decrease in bone volume vs. total volume (BV/TV), trabecular number (Tb.N), and cortical thickness (Ct.Th) with a concomitant increase in trabecular separation (Tb.Sp) in the mutant femora compared with the WT littermate controls. Results are expressed as the mean ± SD of eight independent analyses per group. *P<0.001, significantly different from null mice. (D) Tetracycline-labeled section of the distal femur. The distance between two layers of tetracycline labels (arrows) visualized by epifluorescence represents bone formation that occurred during the 5-d period between tetracycline injections. Mutant mice showed a significant decrease in all parameters of bone formation including mineralized surface/bone surface (MS/BS), mineral apposition rate (MAR) and bone formation rate/bone surface (BFR/BS) as compared with their WT littermates (*P<0.001). Photomicrographs were obtained on the Bioquant analysis system using a ×40 objective.
Figure 2
Figure 2. Changes in osteoblast differentiation and function of 4 week-old Lmna −/− mice.
(A and B) Formation of colony forming units-osteoblasts (CFU-OB) in ex-vivo cultures of bone marrow cells from 3-week-old Lmna −/− mice (lower panels) and WT controls (upper panels). The number of colony forming units-osteoblast (CFU-OB) per femur was significantly higher after 3 wks of differentiation in WT mice compared to Lmna −/− mice (B). (C) Sections of plastic embedded proximal tibiae (secondary spongiosa) from Lmna −/− mice and WT controls (n = 10 per group) were stained sequentially with toluidine blue (upper panels, Magnification ×40) for osteoblasts (black arrows) and osteocytes (red arrows) and ALP (lower panels, Magnification ×20) for osteoblasts (arrows). (D) A significant decrease (−47%) in the number of ALP expressing osteoblasts (N.Ob) and a significant decrease in osteocyte number (N.Ot) (−50%) were seen in Lmna −/− mice compared with WT+/+ mice. Micrographs are representative of those from eight different mice of each genotype. *P<0.001. Changes in osteoblast differentiation and function correlated with changes in a serum biochemical marker of bone formation (P1NP) in Lmna −/− mice compared with WT+/+ mice. *P<0.001. (E) The reduction in osteoblast differentiation in Lmna −/− mice was associated with lower expression of osteocalcin (OCN) and osteopontin (OPN) at the mRNA level. There were no differences in Runx2 expression between Lmna −/− mice and their WT controls. For PCR, data analysis is expressed as the ratio of the gene of interest vs. GAPDH as control. Data represent the mean±SD of triplicate determinations. *P<0.001.
Figure 3
Figure 3. Changes in osteoclast number and function of 4 week-old Lmna −/− mice.
(A) Sections of plastic embedded proximal tibiae from Lmna −/− mice and WT (n = 10 per group) were stained sequentially for TRAP (osteoclasts, OC) (arrows, Magnification ×40). A significant decrease in the number of OC (N.Oc) showing TRAP enzyme activity (B) was seen in Lmna −/− mice compared with WT controls. In addition, osteoclasts in the Lmna −/− mice showed an aberrant phenotype including giant size and vacuolization (arrows). Micrographs are representative of those from eight different mice of each genotype. *p<0.001. (B) Changes in bone cellularity correlated with changes in serum biochemical markers of bone resorption (CTx: C-telopeptides) in Lmna −/− mice compared with WT controls. *P<0.01.
Figure 4
Figure 4. Mechanism of bone loss in Lmna −/− mice.
(A and B) Expression of lamin A is abolished in Lmna −/− mice as compared with their WT controls. (*P<0.001) (A). Furthermore, no difference in protein levels of Runx2 were identified in protein extracts from Lmna −/− mice vs. WT control (B). Finally, expression levels of MAN-1 were significantly higher in Lmna −/− mice as compared with their WT counterpart (B). Protein levels relative to tubulin were quantified by densitometry. Data represent the mean±SD of triplicate determinations. *P<0.001. (C) Bone marrow cells obtained from Lmna −/− mice showed a significant reduction in Runx2 DNA binding activity as compared with WT controls (*P<0.01). The data are representative of three different experiments. (D) Confocal microscopy of nuclei of marrow precursors (passage 2) obtained from tibiae of Lmna −/− and WT controls and cultured ex vivo in MSC growth media for 3 days. In cells obtained from WT mice, Runx2 (green) is widely distributed in the nucleus (upper panels, white arrows) whereas MAN-1 (red) distribution is mostly limited to the nuclear envelope. In contrast, in absence of lamin A/C (lower panels), both Runx2 and MAN1 share the same nuclear peripheral colocalization with extremely low levels of Runx2 expression (green) seen in the interior of the nuclei. Note also the smaller nuclei in MSC obtained from the mutants. DAPI (blue) was used as counterstaining only at lower magnification (left panels). In right panels, Arrows denote size of colocalization (right panels). Images are representative of cell cultures from 6 different mice.

References

    1. Chan GK, Duque G. Age-related bone loss: old bone, new facts. Gerontology. 2002;48:62–71. - PubMed
    1. Gimble JM, Zvonic S, Floyd ZE, Kassem M, Nuttall ME. Playing with bone and fat. J Cell Biochem. 2006;98:251–266. - PubMed
    1. Rosen CJ, Bouxsein ML. Mechanisms of disease: is osteoporosis the obesity of bone? Nat Clin Pract Rheumatol. 2006;2:35–43. - PubMed
    1. Kudlow BA, Kennedy BK. Aging: progeria and the lamin connection. Curr Biol. 2010;16:R652–654. - PubMed
    1. Hutchison CJ, Worman HJ. A-type lamins: guardians of the soma? Nat Cell Biol. 2004;6:1062–1067. - PubMed

Publication types

MeSH terms