. 2011 Jul 1;355(1):21-31.
doi: 10.1016/j.ydbio.2011.04.026. Epub 2011 Apr 28.

The molecular and cellular basis of variable craniofacial phenotypes and their genetic rescue in Twisted gastrulation mutant mice

Affiliations

The molecular and cellular basis of variable craniofacial phenotypes and their genetic rescue in Twisted gastrulation mutant mice

Charles J Billington Jr et al. Dev Biol. .

Abstract

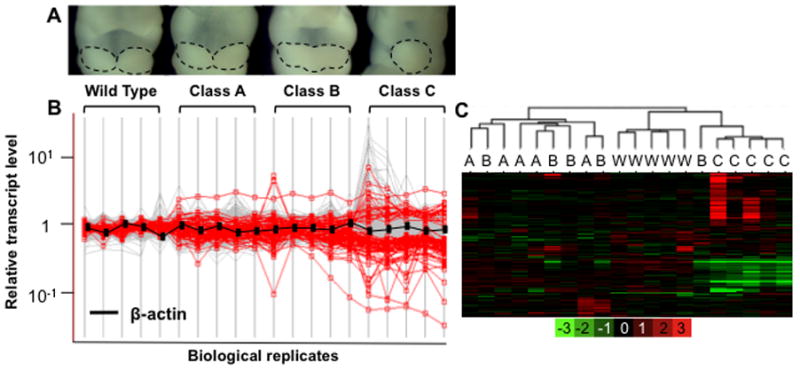
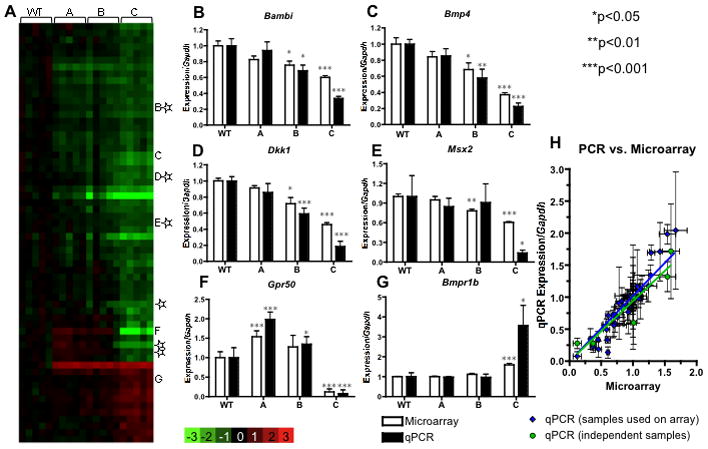
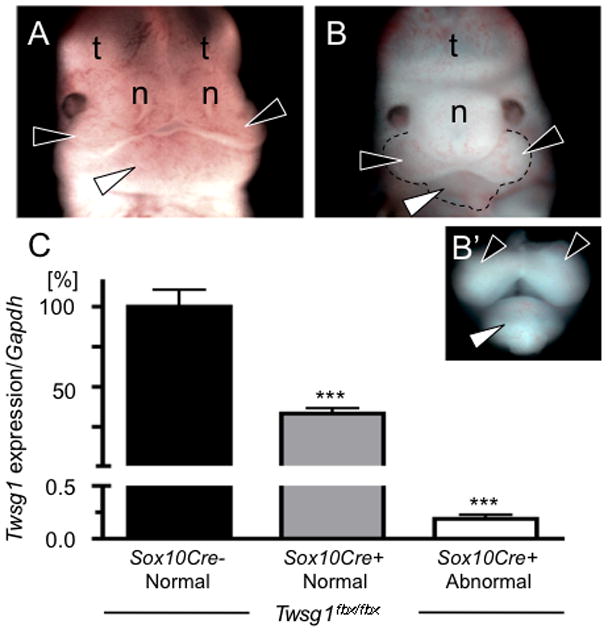
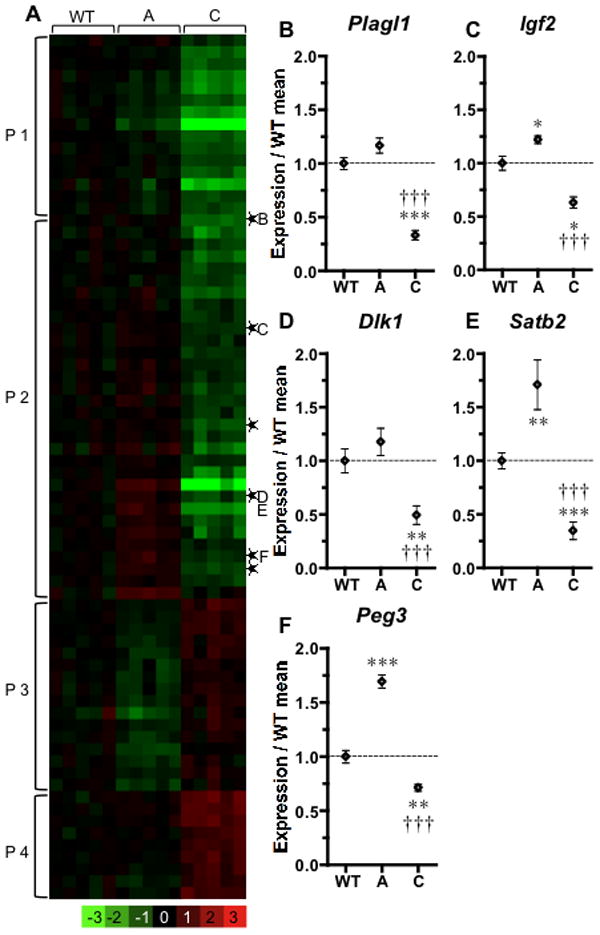
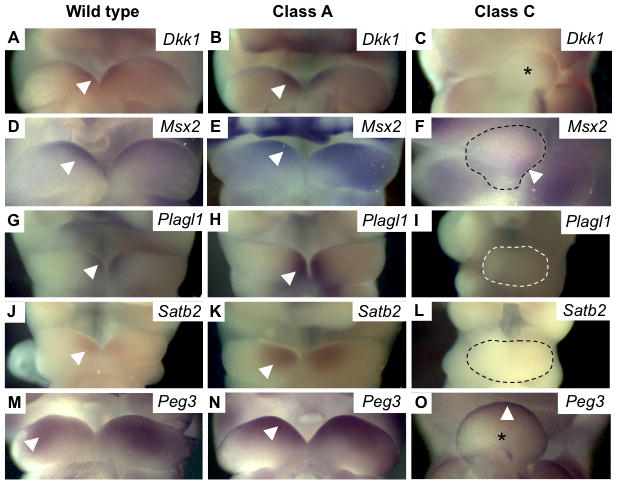
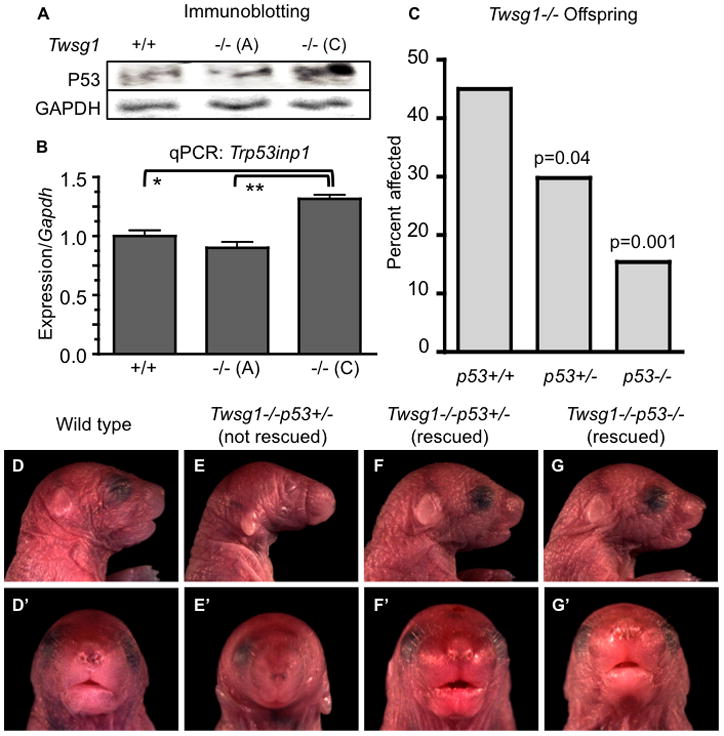
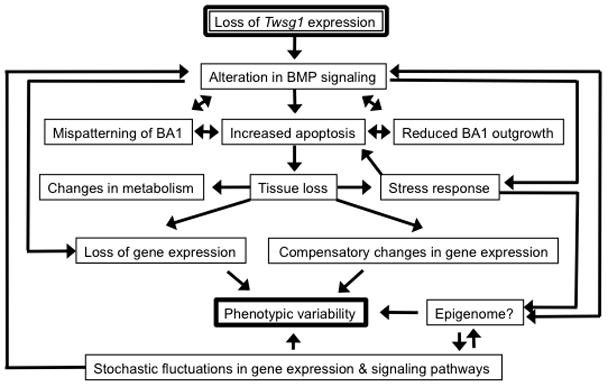
The severity of numerous developmental abnormalities can vary widely despite shared genetic causes. Mice deficient in Twisted gastrulation (Twsg1(-/-)) display such phenotypic variation, developing a wide range of craniofacial malformations on an isogenic C57BL/6 strain background. To examine the molecular basis for this reduced penetrance and variable expressivity, we used exon microarrays to analyze gene expression in mandibular arches from several distinct, morphologically defined classes of Twsg1(-/-) and wild type (WT) embryos. Hierarchical clustering analysis of transcript levels identified numerous differentially expressed genes, clearly distinguishing severely affected and unaffected Twsg1(-/-) mutants from WT embryos. Several genes that play well-known roles in craniofacial development were upregulated in unaffected Twsg1(-/-) mutant embryos, suggesting that they may compensate for the loss of TWSG1. Imprinted genes were overrepresented among genes that were differentially expressed particularly between affected and unaffected mutants. The most severely affected embryos demonstrated increased p53 signaling and increased expression of its target, Trp53inp1. The frequency of craniofacial defects significantly decreased with a reduction of p53 gene dosage from 44% in Twsg1(-/-)p53(+/+) pups (N=675) to 30% in Twsg1(-/-)p53(+/-) (N=47, p=0.04) and 15% in Twsg1(-/-)p53(-/-) littermates (N=39, p=0.001). In summary, these results demonstrate that phenotypic variability in Twsg1(-/-) mice is associated with differential expression of certain developmentally regulated genes, and that craniofacial defects can be partially rescued by reduced p53 levels. We postulate that variable responses to stress may contribute to variable craniofacial phenotypes by triggering differential expression of genes and variable cellular apoptosis.


Figures

Figure 1
Figure 1. Association between phenotypic classes and expression differences
(A) Morphological differences between phenotypic classes of E10.5 embryos are displayed. Dotted lines outline the mandibular components of BA1. (B): Gene expression levels are expressed on a log10 scale (y-axis) vs. an average of WT samples (Y=1) for a given gene. Each vertical line represents a biological replicate from given phenotypic classes (WT, A, B, or C). Genes that are differentially expressed between WT and class C, based on a fold change of 1.5 fold or greater and a false discovery rate of 10% or less, are highlighted (red). Compared with WT gene expression levels, variation is greatest in the most severely affected embryos (class C). (C) Unsupervised hierarchical clustering of array data. Class C samples are clearly separated from WT and class A samples. Class B represents an intermediate phenotype, clustering alternatively with either A or C. The log2 scale of the expression values is shown in the key at the bottom.
Figure 2
Figure 2. Gene expression differences between wild type and severely affected mutants
(A) A heatmap displays gene expression changes compared to the average of WT. Genes with expression changes >1.5 fold and with a false discovery rate of <10% are presented as rows. Each column represents a biological replicate. (B–G) Q-PCR confirmation; ✩genes confirmed by in situ hybridization in Fig. 4; *significance in comparison with WT. (H) Scatter plot showing close correlation between microarray data and Q-PCR data for genes in panels B–G (blue) and independent RNA samples (green) for Gpr50, Bmp4 and Bmpr1b.
Figure 3
Figure 3. The frequency of craniofacial defects in mice with NCC-specific deletion of Twsg1
Twsg1flox/flox;Sox10Cre+ embryos included both (A) normal appearing embryos (black arrowheads point to the maxillary components of BA1; white arrowhead to the mandibular component; n, nasal prominences; t, telencephalic vesicles) and (B) embryos with craniofacial abnormalities, including fusion of the mandibular arches, nasal processes, and telencephalic vesicles (B’f) Dissection of the mandibular and maxillary components of BA1 highlights hypoplasia and midline fusion of the mandibular prominences that characterizes the severe Twsg1 phenotype. (C) Expression levels of Twsg1, measured using primers to exon 4 and 5 were compared between Twsg1flox/flox;Sox10Cre- and Twsg1flox/flox;Sox10Cre+ depending on the presence or absence of external craniofacial abnormalities. A reduction of Twsg1 levels to less than 0.2% of the wild type expression in BA1 at E11.5 resulted in craniofacial defects. Both maxillary and mandibular prominences were collected as shown in B’. Q-PCR was performed using individual mRNA samples. Three embryos per group were analyzed, ***p<0.001 (compared to Twsg1flox/flox;Cre embryos).
Figure 4
Figure 4. Gene expression differences between unaffected and severely affected mutants
(A) A heatmap of expression changes in various phenotypic classes was compared to the average of WT. Genes with expression changes >1.5 fold and with a false discovery rate of <10% are presented as rows. Imprinted genes. (B–F) Q-PCR confirmation. Significance levels in comparison with WT (*) or with class A (†); three symbols represent p<0.001; two, p<0.01; one, p<0.05.
Figure 5
Figure 5. Validation of differential gene expression by in situ hybridization
Photomicrographs of embryos from different phenotype classes, probed by in situ hybridization for (A–C) Dkk1 and (D–F) Msx2, show similar expression levels between WT and class A, but profoundly decreased expression in class C. (G–I) Plagl1, (J–L) Satb2 and (M–O) Peg3 show increased expression in class A and markedly decreased expression in class C. These represent various patterns of differential gene expression as described in the text. Arrowheads indicate expression domains within BA1. Fused mandibular prominences of BA1 are either marked with an asterisk or outlined with a dashed line.
Figure 6
Figure 6. Prevention of craniofacial defects Twsg1−/− mice by a genetic deletion of p53
(A) Western blotting for p53 using whole E10.5 embryos indicates increased p53 protein levels in Twsg1−/− class C, compared to Twsg1−/− class A or WT embryos. GAPDH levels were consistent across these samples (B) Q-PCR measurement of Trp53inp1 transcript levels confirms microarray data indicating upregulation of this gene in class C embryos with a trend toward reduction in class A embryos (C) Decreasing incidence of craniofacial defects among Twsg1−/− pups is associated with reduced p53 gene dosage. *p<0.05, **p<0.01, ***p=0.001. Representative images of neonates with their corresponding genotypes, lateral view (D–G) and frontal view (D’–G’).
Figure 7
Figure 7. Model for interrelated processes leading to craniofacial phenotypes and craniofacial phenotypic variability in Twsg1−/− mice
Loss of TWSG1 disrupts the BMP gradient within BA1, which leads to mispatterning of BA1, increased cellular stress, increased apoptosis, and reduced outgrowth. Apoptotic tissue loss and loss of peak BMP activity lead to a reduction in BMP targets and other genes expressed in the distal region of BA1 and evoke stress and metabolic responses as well as compensatory changes in gene expression. This is compounded by likely changes in the epigenome as well as stochastic fluctuations in gene expression and signaling pathways, leading to phenotypic variation.

References

    1. Benjamini Y, Hochberg Y. Controlling the false discovery rate: a practical and powerful approach to multiple testing. Journal of the Royal Statistical Society. Series B 1995
    1. Berdal A, Molla M, Hotton D, Aïoub M, Lézot F, Néfussi JR, Goubin G. Differential impact of MSX1 and MSX2 homeogenes on mouse maxillofacial skeleton. Cells, tissues, organs. 2009;189:126–132. - PubMed
    1. Bobola N, Carapuco M, Ohnemus S, Kanzler B, Leibbrandt A, Neubuser A, Drouin J, Mallo M. Mesenchymal patterning by Hoxa2 requires blocking Fgf-dependent activation of Ptx1. Development. 2003;130:3403–3414. - PubMed
    1. Braybrook C, Doudney K, Marcano AC, Arnason A, Bjornsson A, Patton MA, Goodfellow PJ, Moore GE, Stanier P. The T-box transcription factor gene TBX22 is mutated in X-linked cleft palate and ankyloglossia. Nat Genet. 2001;29:179–183. - PubMed
    1. Bruce S, Hannula-Jouppi K, Peltonen J, Kere J, Lipsanen-Nyman M. Clinically Distinct Epigenetic Subgroups in Silver-Russell Syndrome: The Degree of H19 Hypomethylation Associates with Phenotype Severity and Genital and Skeletal Anomalies. Journal of Clinical Endocrinology & Metabolism. 2009;94:579–587. - PubMed

Publication types

Substances