

Protein signatures for survival and recurrence in metastatic melanoma
- PMID: 21549228
- PMCID: PMC3178099
- DOI: 10.1016/j.jprot.2011.04.013
Protein signatures for survival and recurrence in metastatic melanoma
Abstract
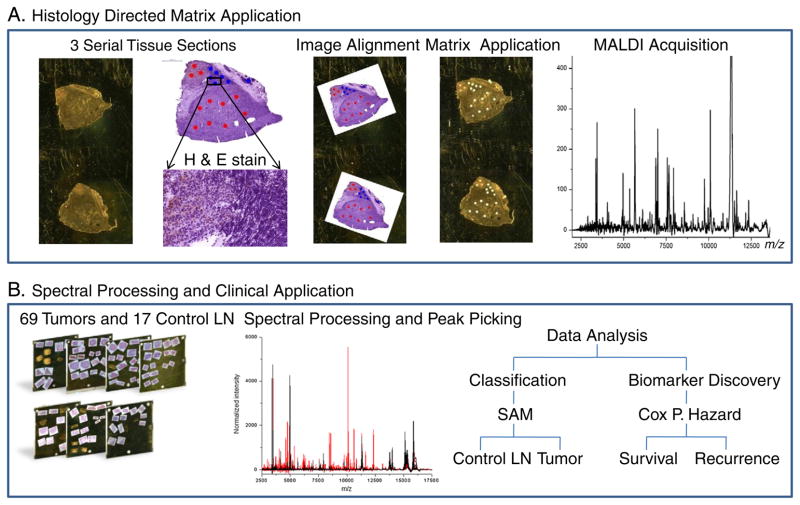
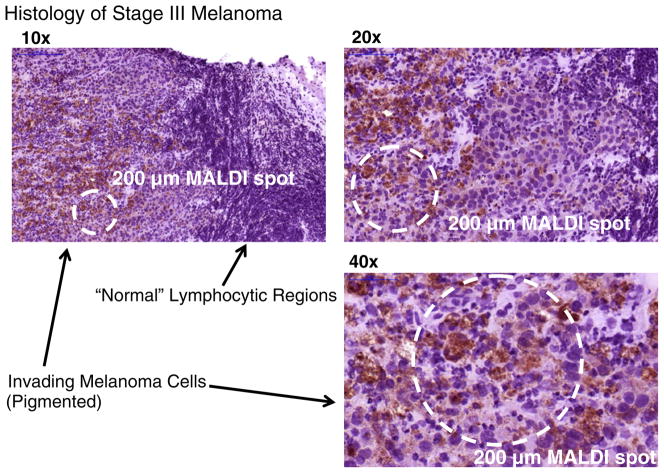
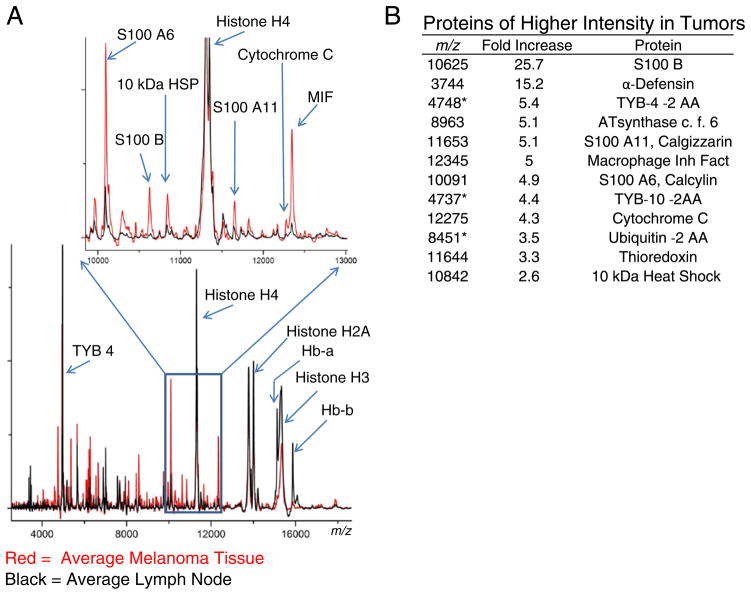
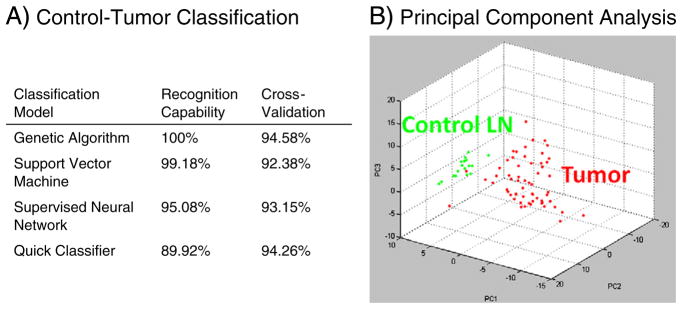
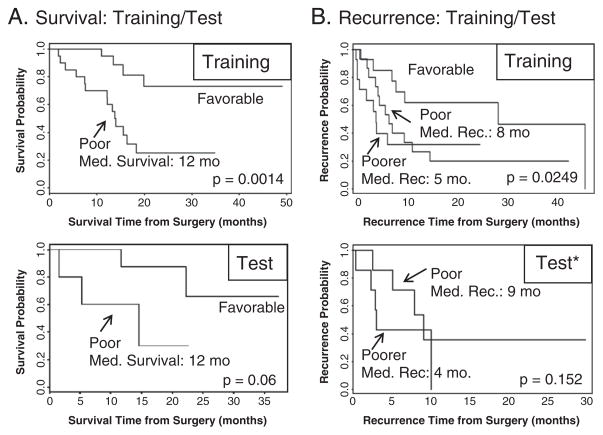
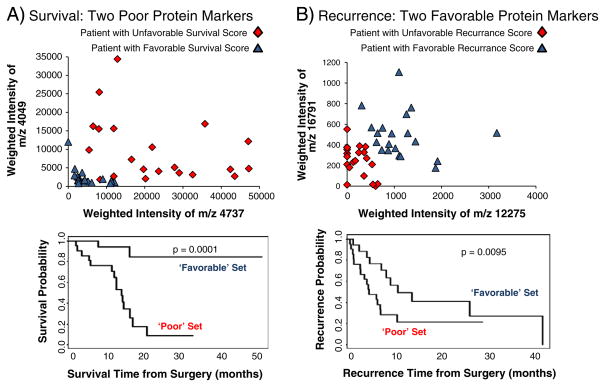
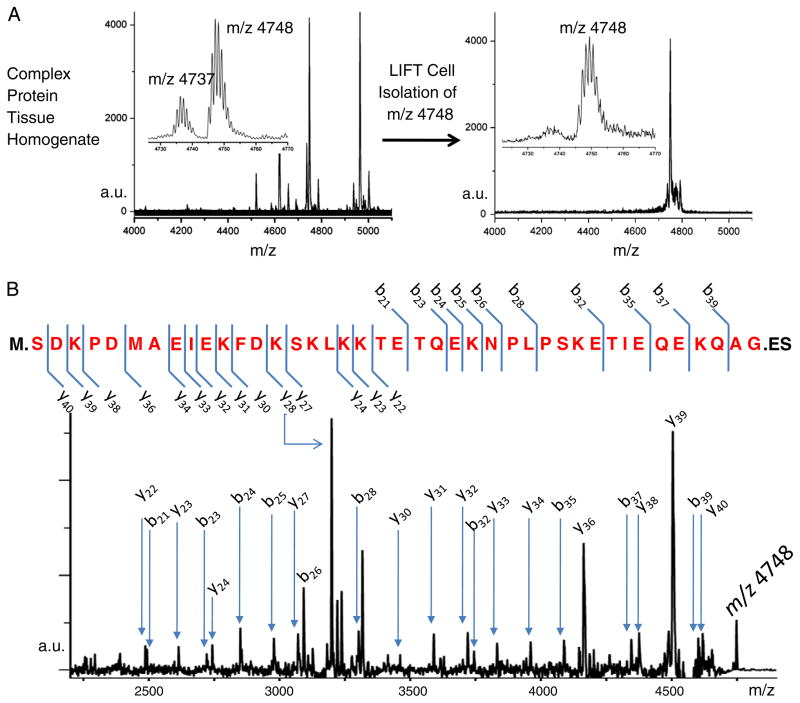
Patients with melanoma metastatic to regional lymph nodes exhibit a range in tumor progression, survival, and treatment. Current approaches to stratify patients with this stage of disease predominantly involve clinical and histological methods. Molecular classification thus far has focused almost exclusively on genetic mutations. In this study, proteomic data from 69 melanoma lymph node metastases and 17 disease free lymph nodes acquired by histology-directed MALDI imaging mass spectrometry were used to classify tumor from control lymph node and to molecularly sub-classify patients with stage III disease. From these data, 12 survival associated protein signals and 3 recurrence associated signals in the acquired mass spectra were combined to generate a multiplex molecular signature to group patients into either poor or favorable groups for recurrence and survival. Proteins represented in the signature include cytochrome c, s100 A6, histone H4, and cleaved forms of thymosin β-4, thymosin β-10, and ubiquitin. In total over 40 protein signals from the tissue were identified.
Copyright © 2011 Elsevier B.V. All rights reserved.
Figures
Similar articles
-
Tumor PD-L1 expression, immune cell correlates and PD-1+ lymphocytes in sentinel lymph node melanoma metastases.Mod Pathol. 2015 Dec;28(12):1535-44. doi: 10.1038/modpathol.2015.110. Epub 2015 Sep 25. Mod Pathol. 2015. PMID: 26403784
-
Characterization of micrometastatic disease in melanoma sentinel lymph nodes by enhanced pathology: recommendations for standardizing pathologic analysis.Am J Surg Pathol. 2005 Mar;29(3):305-17. doi: 10.1097/01.pas.0000152134.36030.b7. Am J Surg Pathol. 2005. PMID: 15725798
-
Sentinel lymph node biopsy in patients with thin primary cutaneous melanoma.Ann Surg. 2012 Jan;255(1):128-33. doi: 10.1097/SLA.0b013e3182306c72. Ann Surg. 2012. PMID: 21975320
-
Sentinel node localisation: A new prospective in the treatment of nodal melanoma metastases.Int J Oncol. 1999 Jul;15(1):25-32. doi: 10.3892/ijo.15.1.25. Int J Oncol. 1999. PMID: 10375590 Review.
-
Malignant melanoma and the sentinel lymph node biopsy.Cancer Invest. 1999;17(1):39-46. Cancer Invest. 1999. PMID: 10999048 Review. No abstract available.
Cited by
-
Rapid Noninvasive Skin Monitoring by Surface Mass Recording and Data Learning.JACS Au. 2021 May 24;1(5):598-611. doi: 10.1021/jacsau.0c00074. Epub 2021 Mar 22. JACS Au. 2021. PMID: 34056635 Free PMC article.
-
Tumor tissue hnRNP M and HSP 90α as potential predictors of disease-specific mortality in patients with early-stage cutaneous head and neck melanoma: A proteomics-based study.Oncotarget. 2019 Nov 19;10(62):6713-6722. doi: 10.18632/oncotarget.27333. eCollection 2019 Nov 19. Oncotarget. 2019. PMID: 31803364 Free PMC article.
-
High expression of thymosin beta 10 predicts poor prognosis for hepatocellular carcinoma after hepatectomy.World J Surg Oncol. 2014 Jul 18;12:226. doi: 10.1186/1477-7819-12-226. World J Surg Oncol. 2014. PMID: 25037578 Free PMC article.
-
Ultra-High Mass Resolution MALDI Imaging Mass Spectrometry of Proteins and Metabolites in a Mouse Model of Glioblastoma.Sci Rep. 2017 Apr 4;7(1):603. doi: 10.1038/s41598-017-00703-w. Sci Rep. 2017. PMID: 28377615 Free PMC article.
-
Mass spectrometry-based chemical mapping and profiling toward molecular understanding of diseases in precision medicine.Chem Sci. 2021 May 25;12(23):7993-8009. doi: 10.1039/d1sc00271f. eCollection 2021 Jun 16. Chem Sci. 2021. PMID: 34257858 Free PMC article. Review.
References
-
- Cancer Facts and Figures 2008. American Cancer Society; 2008.
-
- Slominski A, Tobin DJ, Shibahara S, Wortsman J. Melanin pigmentation in mammalian skin and its hormonal regulation. Physiol Rev. 2004;84(4):1155–228. - PubMed
-
- Yamaguchi Y, Brenner M, Hearing VJ. The regulation of skin pigmentation. J Biol Chem. 2007;282(38):27557–61. - PubMed
-
- Mendelsohn J. The molecular basis of cancer. 2. Saunders; Philadelphia: 2001. pp. 385–400.
-
- Greene FL American Joint Committee on Cancer, American Cancer Society. AJCC cancer staging handbook : from the AJCC cancer staging manual. 6. New York: Springer; 2002. p. xv.p. 469.
Publication types
MeSH terms
Substances
Grants and funding
LinkOut - more resources
Full Text Sources
Other Literature Sources
Medical
