. 2011 May 6;42(3):367-77.
doi: 10.1016/j.molcel.2011.03.024.

Single-molecule fluorescence measurements of ribosomal translocation dynamics

Affiliations

Single-molecule fluorescence measurements of ribosomal translocation dynamics

Chunlai Chen et al. Mol Cell. .

Abstract

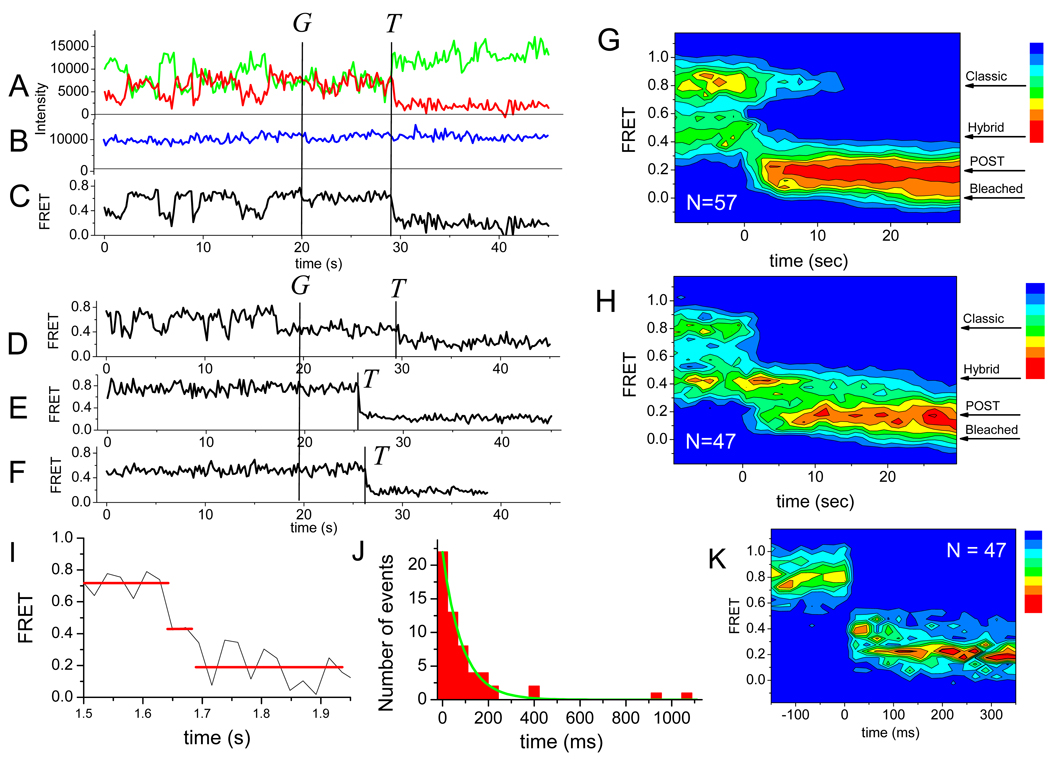
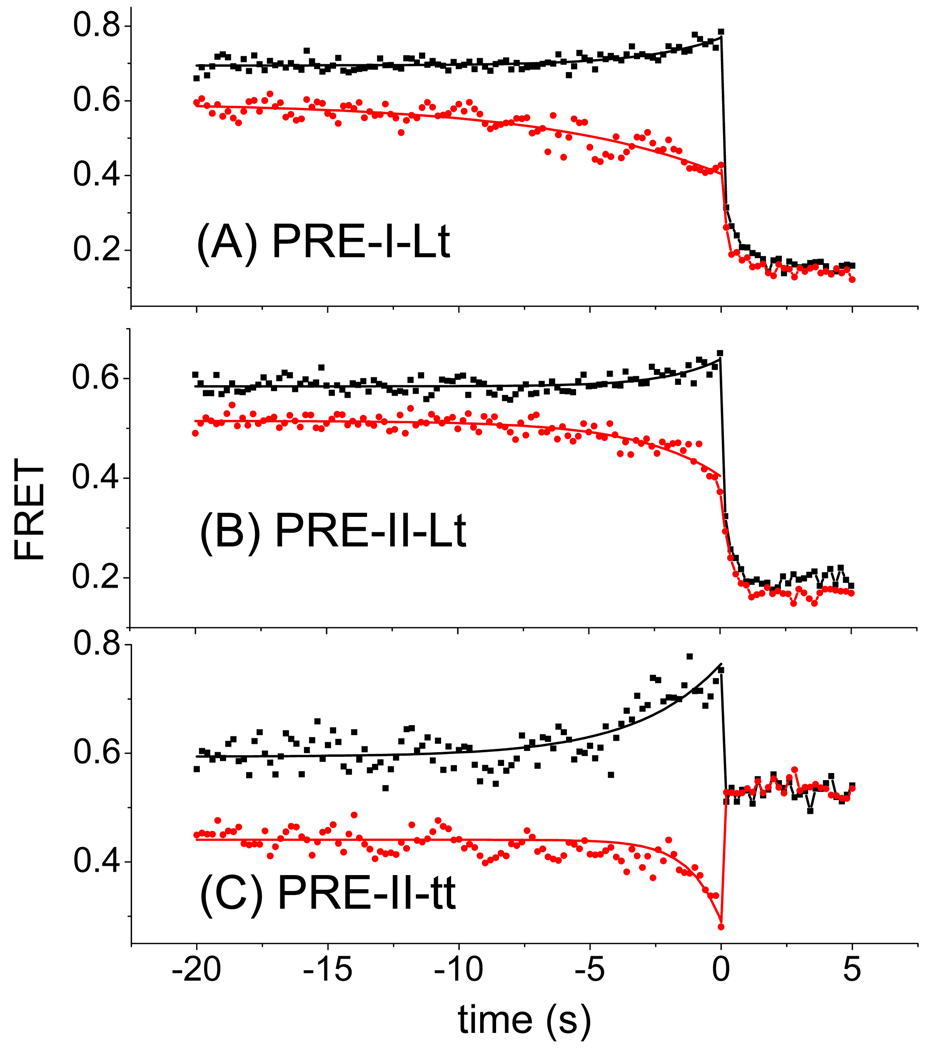
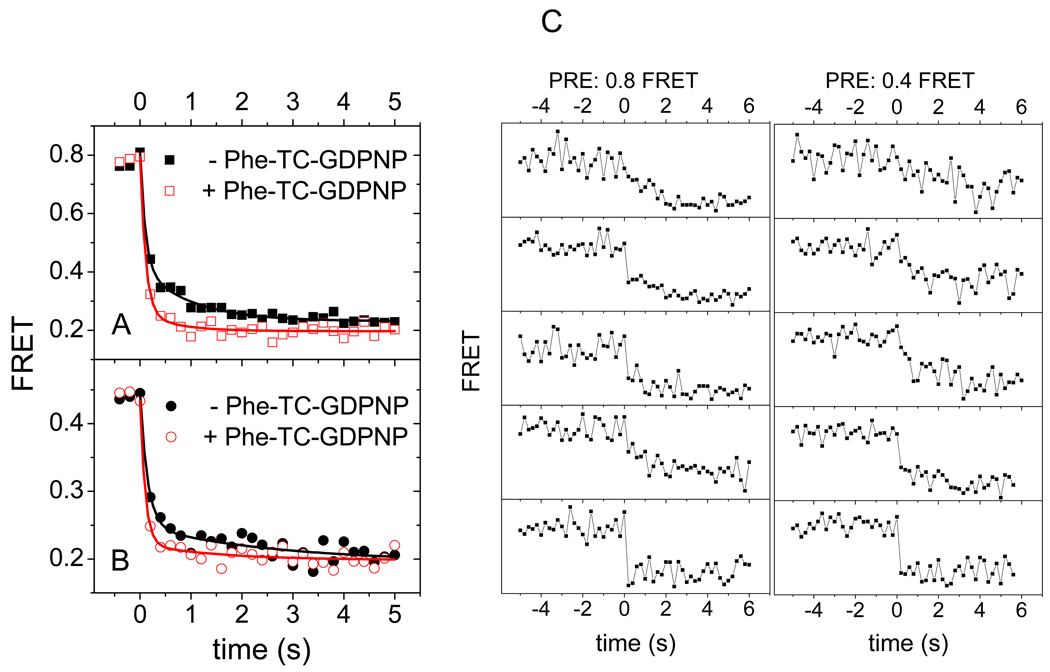
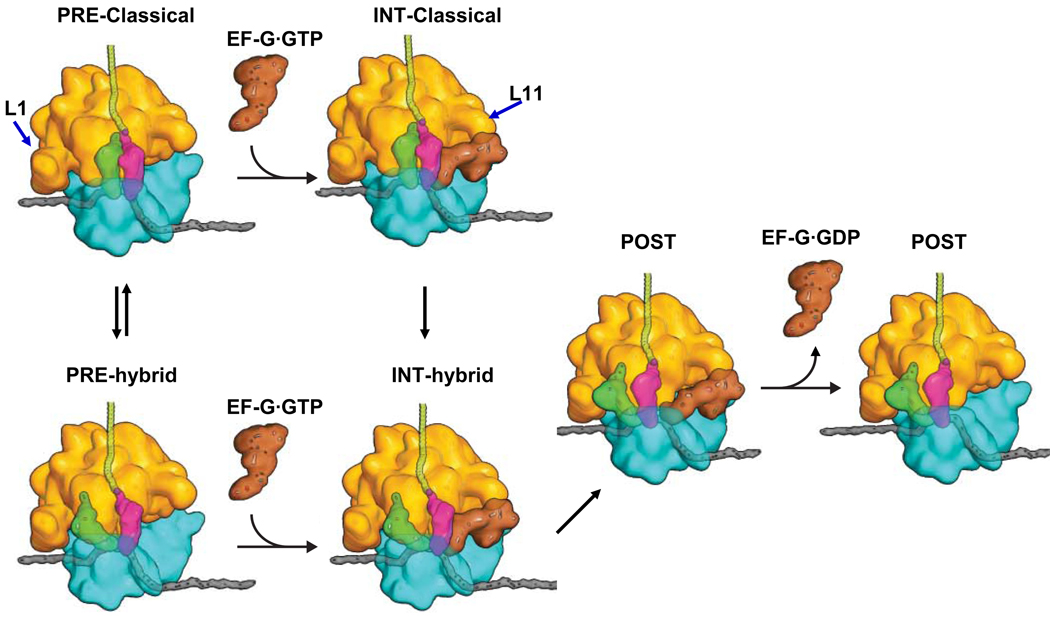
We employ single-molecule fluorescence resonance energy transfer (smFRET) to study structural dynamics over the first two elongation cycles of protein synthesis, using ribosomes containing either Cy3-labeled ribosomal protein L11 and A- or P-site Cy5-labeled tRNA or Cy3- and Cy5-labeled tRNAs. Pretranslocation (PRE) complexes demonstrate fluctuations between classical and hybrid forms, with concerted motions of tRNAs away from L11 and from each other when classical complex converts to hybrid complex. EF-G⋅GTP binding to both hybrid and classical PRE complexes halts these fluctuations prior to catalyzing translocation to form the posttranslocation (POST) complex. EF-G dependent translocation from the classical PRE complex proceeds via transient formation of a short-lived hybrid intermediate. A-site binding of either EF-G to the PRE complex or of aminoacyl-tRNA⋅EF-Tu ternary complex to the POST complex markedly suppresses ribosome conformational lability.


Figures

Figure 1
Figure 1
A: The elongation cycle ( modified from Schmeing and Ramakrishnan, 2009). The L11 and L1 regions are indicated by arrows. B: Schematic of the complexes studied. Top and bottom rows are for L11-tRNA (Lt) and tRNA-tRNA (tt) FRET complexes, respectively, for elongation cycles I and II. The formula image 
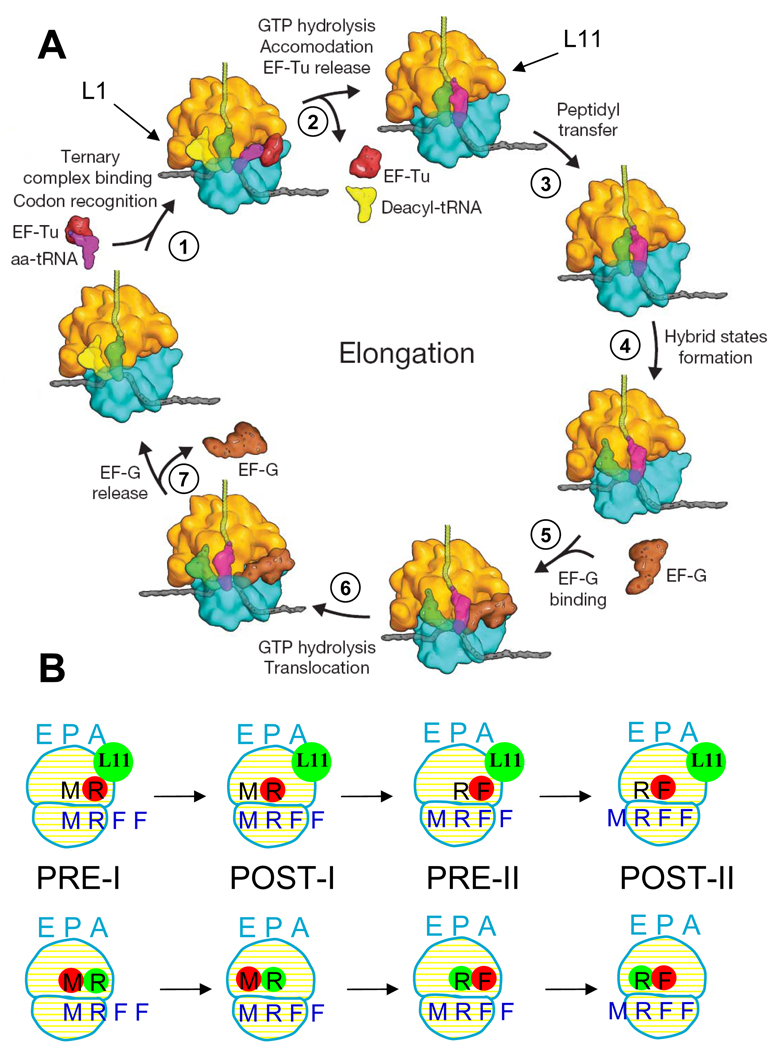
colored letters M, R and F indicate mRNA codons for fMet, Arg and Phe. The black letters M, R, and F refer to tRNAfMet, tRNAArg and tRNAPhe. formula image dots indicate Cy5 labeling of the tRNAs. formula image dots indicate Cy3 labeling of L11 or tRNA in Lt or tt complexes, respectively.
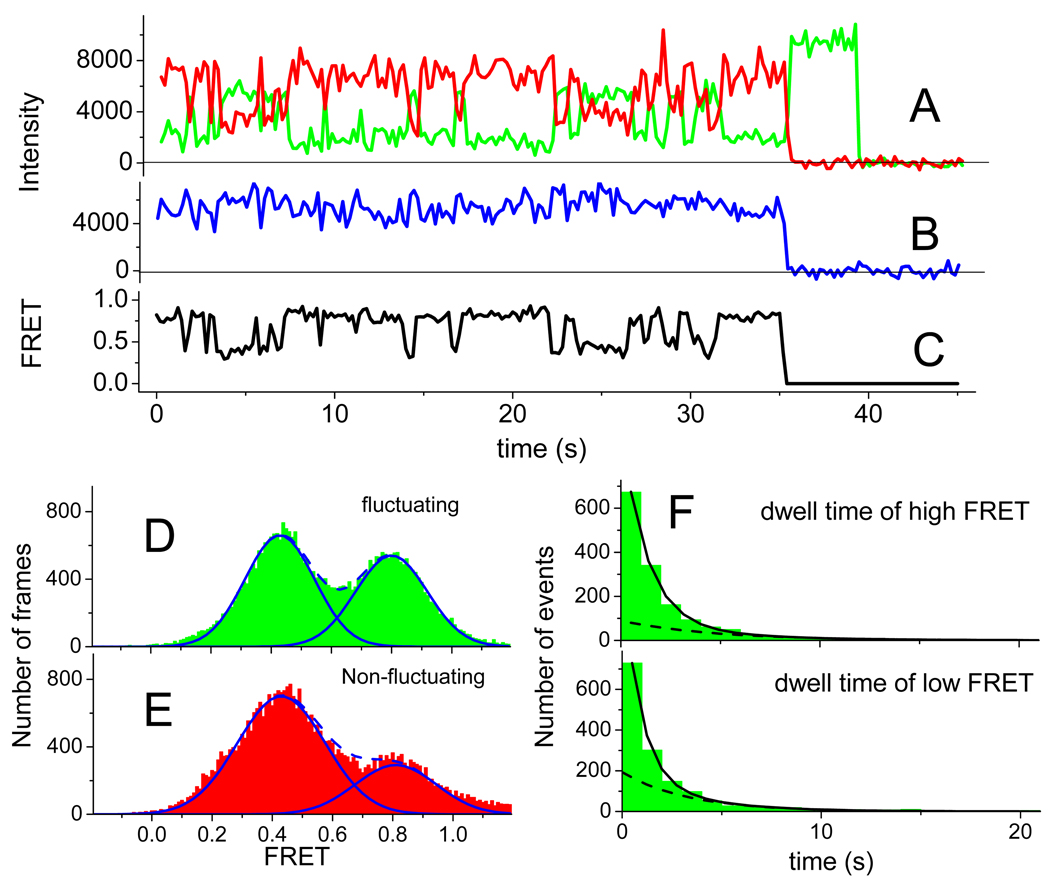
Figure 2
Figure 2. Time courses of fluorescence intensity and FRET for the PRE-I(Lt) complex
Time zero designates when the recording was started. A: Cy3 (green) and Cy5 (red) fluorescence intensity traces under excitation of the Cy3 with 532 nm TIRF illumination at 100 ms integration time per frame. Cy5 fluorescence under this condition is sensitized emission due to FRET. Cy5 and Cy3 bleach at 35 s and 40 s, respectively. B: Fluorescence (blue trace) from Cy5 under direct excitation at 640 nm. Alternating laser excitation (ALEX) every other frame was accomplished by synchronizing the AOTF shown in Figure S5 with the camera. C: FRET ratio. D and E: Temporal histograms of FRET values of fluctuating (green) and non-fluctuating (red) complexes. The solid fitted lines are Gaussian distributions and the dashed lines are the sums of two Gaussian distributions. In part D., the distributions are fitted to the intervals of high FRET and low FRET output obtained from hidden Markov (HaMMy) analysis. F: Event histograms of high FRET (upper) and low FRET (lower) and the sum of two exponential decay components fitted to the data. The dashed line within each time course is the slower exponential component. See also Figures S1a–c and Tables S1 and S2.
Figure 3
Figure 3. Fluorescence and FRET traces for EF-G·GTP translocation of PRE-I(Lt)
Times of EF-G·GTP injection (G) and of translocation (T) are marked. A: C: ALEX presentation of data from a fluctuating ribosome that translocated from the high FRET state. Color coding as in Figure 2. D: F: Sample FRET efficiency traces of translocation from D: a fluctuating ribosome translocating from the low FRET state; E: a stable high FRET state; and F: a stable low FRET state. G: and H: FRET probability density plots for translocation of fluctuating PRE complexes from high and low FRET states, respectively. All traces are aligned to EF-G·GTP addition as t = 0. Noteworthy are the halts in fluctuations that follow EF-G·GTP addition. I: FRET efficiency traces of translocation from a high FRET PRE state through a low FRET intermediate state to a POST state recorded at a higher time resolution (11 ms integration time per frame with ALEX (alternating-laser excitation) between 532 nm and 640 nm lasers.) than other traces shown in this paper – see Experimental J: Dwell time distribution of the low FRET translocation intermediate lifetime. The curve is a single exponential fit to the data. K: FRET probability density plot for translocation from the high FRET state at the higher time resolution shown in part I. All traces are aligned to the translocation event as t = 0.
Figure 4
Figure 4. Post-synchronized, averaged translocation traces of fluctuating PRE complexes translocated from high FRET (black squares) and low FRET (red circles) PRE states
A: PRE-I(Lt) B: PRE-II(Lt) C: PRE(II-tt). Average FRET values as a function of time were calculated by post-synchronizing all translocation events to the time (t = 0) of maximum FRET change. The solid curves are fits of the equation E = Eo + ΔE (1 − ekt) to the results from t = 0 s to t = −20 s, where E is the average FRET value as a function of time, Eo is the FRET value at t = 0, Eo + ΔE is the asymptotic FRET value at large negative time, and k is the apparent rate constant kb.
Figure 5
Figure 5. Effect of added Phe-tRNAPhe·EF-Tu·GDPNP (F-TC) on Pre-I(Lt) translocation
Post-synchronized, averaged translocation traces from A: high FRET state and B: low FRET state of PRE-I(Lt) complexes in the absence (solid dots) or presence (hollow dots) of the next cognate TC, added as Phe-tRNAPhe·EF-Tu·GDPNP. Average FRET values as a function of time were calculated by post-synchronizing all translocation events to the time (t = 0) of maximum FRET change. The solid curves are fits of the equation E = Eo + ΔEf exp(−kft) + ΔEs exp(−kst) to the results from t = 0 s to t = 5 s, where E is the average FRET value as a function of time, E is the FRET value at t = ∞, kf > ks, ΔEf is the amplitude of fast phase, and ΔEs is the amplitude of slow phase. ΔE values are: A: (−TC) ΔEf 0.39 ± 0.04; ΔEs 0.19 ± 0.03: (+TC) ΔEf 0.53 ± 0.04; ΔEs 0.06 ± 0.02. B: (−TC) ΔEf 0.20 ± 0.02; ΔEs 0.06 ± 0.02: (+TC) ΔEf 0.24 ± 0.02; ΔEs 0.022 ± 0.015. FRET probability density plots corresponding to parts A and B are presented in Figure S4. C: Selected FRET trajectories of EF-G catalyzed translocation of PRE-I(Lt) in the absence of the next cognate TC from classical (FRET ~0.8) (left) or hybrid (FRET ~0.4) (right) pretranslocation states.
Figure 6
Figure 6. EF-G binding and tRNA movement during translocation
Earlier ensemble and smFRET results demonstrated that PRE complex, which fluctuates between classical and hybrid states, is converted to POST complex via an INT intermediate (Pan et al., 2007), such as that depicted. A major new result from this work is the demonstration that EF-G·GTP can bind directly to the classical state of the PRE complex before forming a transient hybrid complex as a short-lived, kinetically competent intermediate in POST complex formation. The hybrid PRE-complex may proceed to POST complex via a similar intermediate. The L11 and L1 regions are indicated by the blue arrows. Additional intermediates, not observed in the present work, would be required for a full description of the translocation mechanism (see text).

References

    1. Agirrezabala X, Frank J. Elongation in translation as a dynamic interaction among the ribosome, tRNA, and elongation factors EF-G and EF-Tu. Q Rev Biophys. 2009;42:159–200. - PMC - PubMed
    1. Agirrezabala X, Lei JL, Brunelle JL, Ortiz-Meoz RF, Green R, Frank J. Visualization of the Hybrid State of tRNA Binding Promoted by Spontaneous Ratcheting of the Ribosome. Mol Cell. 2008;32:190–197. - PMC - PubMed
    1. Antoun A, Pavlov MY, Lovmar M, Ehrenberg M. How initiation factors tune the rate of initiation of protein synthesis in bacteria. Embo J. 2006;25:2539–2550. - PMC - PubMed
    1. Blanchard SC, Gonzalez RL, Kim HD, Chu S, Puglisi JD. tRNA selection and kinetic proofreading in translation. Nat Struct Mol Biol. 2004a;11:1008–1014. - PubMed
    1. Blanchard SC, Kim HD, Gonzalez RL, Puglisi JD, Chu S. tRNA dynamics on the ribosome during translation. P Natl Acad Sci USA. 2004b;101:12893–12898. - PMC - PubMed

Publication types

MeSH terms

LinkOut - more resources