. 2011 May 13;145(4):622-34.
doi: 10.1016/j.cell.2011.03.042. Epub 2011 May 5.

A rapid, extensive, and transient transcriptional response to estrogen signaling in breast cancer cells

Affiliations

A rapid, extensive, and transient transcriptional response to estrogen signaling in breast cancer cells

Nasun Hah et al. Cell. .

Erratum in

  • Cell. 2011 Jun 24;145(7):1156

Abstract

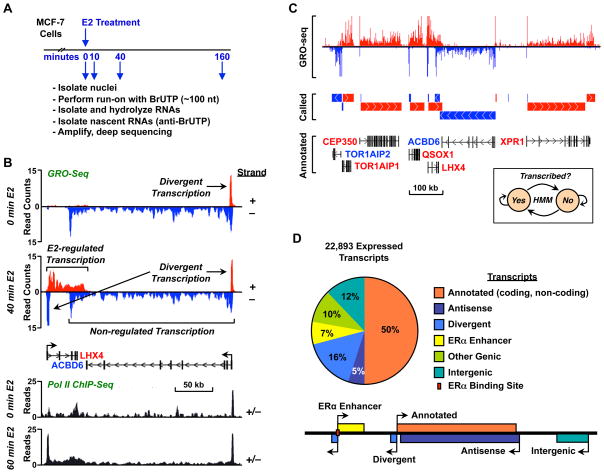
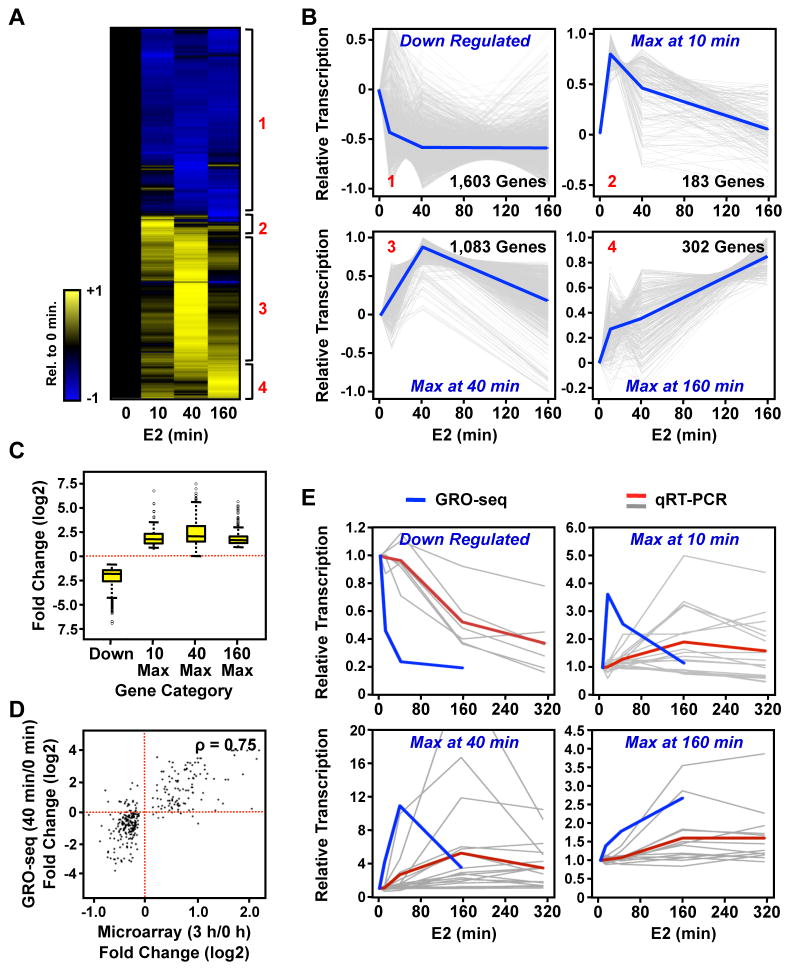
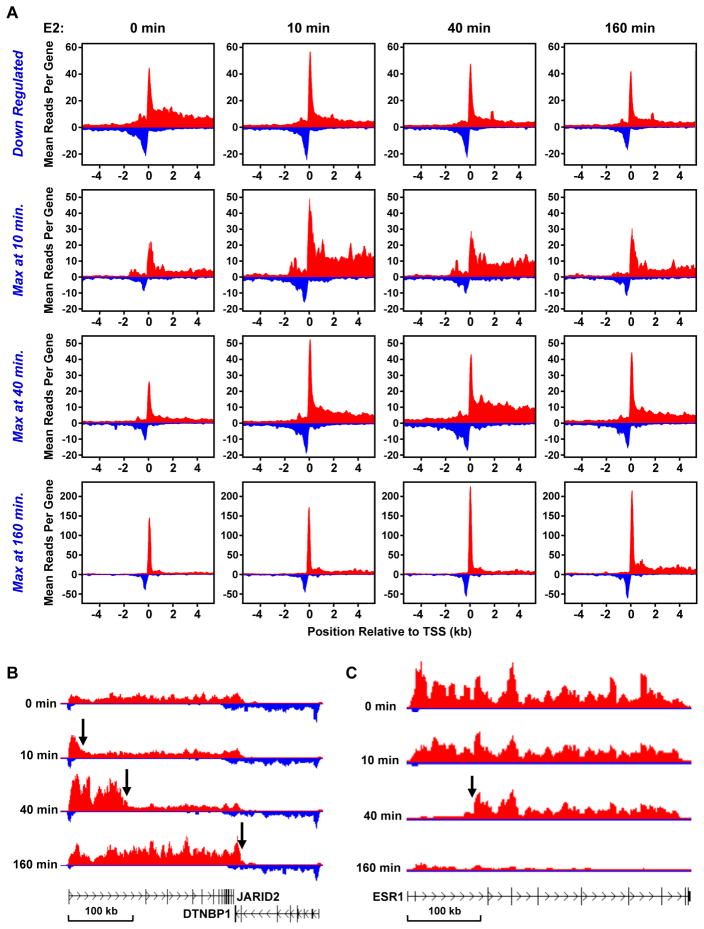
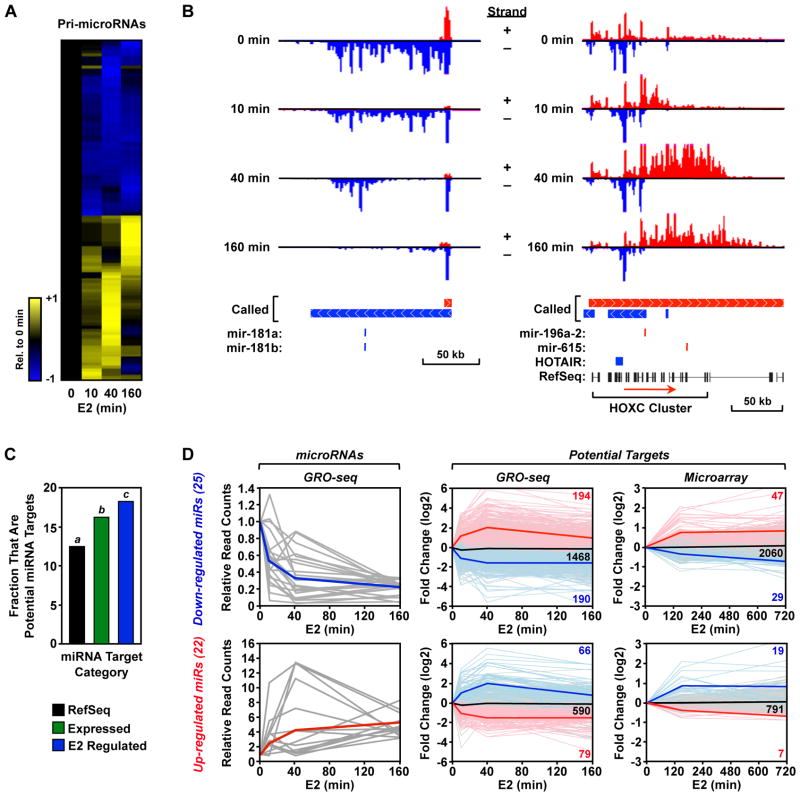
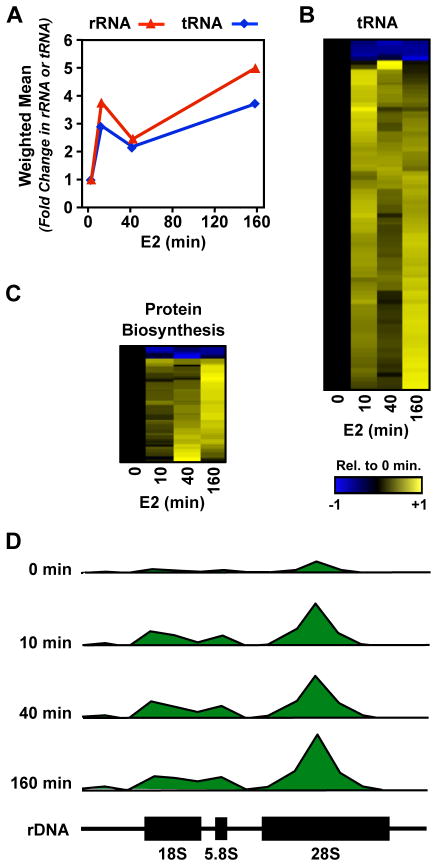
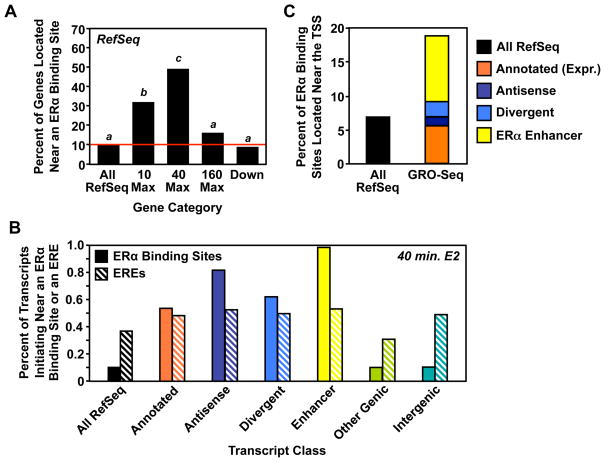
We report the immediate effects of estrogen signaling on the transcriptome of breast cancer cells using global run-on and sequencing (GRO-seq). The data were analyzed using a new bioinformatic approach that allowed us to identify transcripts directly from the GRO-seq data. We found that estrogen signaling directly regulates a strikingly large fraction of the transcriptome in a rapid, robust, and unexpectedly transient manner. In addition to protein-coding genes, estrogen regulates the distribution and activity of all three RNA polymerases and virtually every class of noncoding RNA that has been described to date. We also identified a large number of previously undetected estrogen-regulated intergenic transcripts, many of which are found proximal to estrogen receptor binding sites. Collectively, our results provide the most comprehensive measurement of the primary and immediate estrogen effects to date and a resource for understanding rapid signal-dependent transcription in other systems.


Figures

Figure 1
Figure 1. GRO-seq provides a detailed view of the E2-regulated transcriptome in MCF-7 cells
(A) Overview of the experimental set up for GRO-seq analysis using MCF-7 cells. (B) Genome browser view for a specific locus showing GRO-seq (top) and Pol II ChIP-seq (bottom) data illustrating the features of transcription and the effects of estrogen treatment. (C) De novo detection of transcripts using GRO-seq data (top) and an HMM (inset). Called transcripts (middle) match well to RefSeq annotations (bottom). (D) Classification of transcripts based on the annotation filter (Fig. S1, E and F). See also Figure S1.
Figure 2
Figure 2. A large fraction of MCF-7 transcriptome is regulated by estrogen
(A) The fraction of all transcripts that are regulated by E2 at any time point. (B) The fraction of all transcripts that are up- or down-regulated by E2 at the time point shown. (C) Heatmap representations of time-dependent regulation by E2 for each transcripts class. Values are centered and scaled to the 0 minute time point. (D) The fraction of each class of transcripts that are up- or down-regulated by E2 at each time point. See also Figure S2.
Figure 3
Figure 3. GRO-seq identifies four distinct classes of E2-regulated RefSeq genes
(A) Heatmap of the time course of E2-dependent regulation of RefSeq genes. Red numbers indicate the four different classes of regulation. (B) Centered-scaled traces showing the regulation of the four distinct classes of E2 regulation. Grey lines represent GRO-seq data for individual genes and blue lines represent the mean of the individual traces. (C) Box and whiskers plot showing the E2-dependent fold change for genes in each of the four classes. (D) Correlation between fold changes measured by GRO-seq and expression microarrays for genes that show a change in the microarray analyses. (E) Comparison of GRO-seq data to mRNA expression measured by RT-qPCR. Blue lines represent the mean of the GRO-seq data for the genes analyzed. Grey lines represent RT-qPCR data for individual genes and red lines indicate the mean. See also Figure S3 and Table S1.
Figure 4
Figure 4. GRO-seq reveals the dynamics of E2-dependent transcription
(A) Metagene representations showing the average profile of GRO-seq sequence reads near and at the TSSs of RefSeq genes in each of the four classes during the E2 treatment time course. (B and C) Gene-specific views of the leading (B) and lagging (C) edges of a Pol II “wave” shown for the up-regulated gene JARID2 (B) and the down-regulated gene ESR1 (C), respectively, during the E2 treatment time course. See also Figure S4.
Figure 5
Figure 5. E2 regulates the transcription of primary miRNA genes
(A) Heatmap of the time course of E2-dependent regulation of primary miRNA transcripts. (B) Gene-specific examples of down-regulated (left) and up-regulated (right) primary miRNA genes. Called transcripts and annotations are shown. In the right panel, the “+ strand” called transcript (red) is actually number of smaller called transcripts that, at the resolution used to represent this region, appear as one transcript. (C) Fraction of the specified subset of annotated genes that are predicted to be targets of an E2-regulated miRNA based on TargetScan. Bars with different superscripts are significantly different by Fisher’s exact test (p = 3.7 × 10⁻¹⁴ for a/b; p = 0.03 for b/c; p = 1.8 × 10⁻¹³ for a/c). (D) Right panels, GRO-seq data for pri-miRNA transcripts that are up-regulated (top) or down-regulated) ≥ 3-fold by E2. Grey lines = data for individual genes. Blue lines = average for all genes. Middle and left panels, GRO-seq (middle) and expression microarray (right) data for all of the potential targets of miRNAs encoded by the pri-miRNA transcripts shown in the left panels. Faded red, black, and blue lines = data for individual up-regulated, unregulated, and down-regulated genes, respectively (the counts for each type are listed). Bold red, black, and blue lines = averages for all up-regulated, unregulated, and down-regulated genes, respectively. See also Figure S5.
Figure 6
Figure 6. E2 regulates transcription by Pol I and Pol III
(A) E2-dependent fold-change in the transcription of the 45S rDNA (Pol I) and tRNA (Pol III) genes. (B and C) Heatmap of the time course of E2-dependent regulation of tRNA transcripts (B) or protein coding transcripts encoding genes with a biological function or cellular compartment related to the synthesis, metabolism, or function of mature tRNAs or rRNAs (C). (D) GRO-seq reads mapped to the human rDNA gene (GenBank U13369.1) shown in 1 kb bins relative to the genome location during the time course of E2 treatment. See also Figure S6.
Figure 7
Figure 7. ERα binding sites are enriched in the promoters of primary E2 target genes
(A) The fraction of the specified subset of RefSeq genes with an ERα binding site found within 10 kb of the TSS. Bars with different superscripts are significantly different by Fisher’s exact test (p < 1.2 × 10⁻¹²). (B) The fraction of the specified transcript class defined at 40 min. E2 treatment that initiates near an ERα binding site or an ERE. (C) The fraction ERα binding sites found within 1 kb of either all well-annotated RefSeq genes or the specified subset of de novo transcript annotations determined by GRO-seq analysis.

Comment in

References

    1. Acevedo ML, Kraus WL. Transcriptional activation by nuclear receptors. Essays Biochem. 2004;40:73–88. - PubMed
    1. Beissbarth T, Speed TP. GOstat: find statistically overrepresented Gene Ontologies within a group of genes. Bioinformatics. 2004;20:1464–1465. - PubMed
    1. Boettiger AN, Levine M. Synchronous and stochastic patterns of gene activation in the Drosophila embryo. Science. 2009;325:471–473. - PMC - PubMed
    1. Carroll JS, Liu XS, Brodsky AS, Li W, Meyer CA, Szary AJ, Eeckhoute J, Shao W, Hestermann EV, Geistlinger TR, et al. Chromosome-wide mapping of estrogen receptor binding reveals long-range regulation requiring the forkhead protein FoxA1. Cell. 2005;122:33–43. - PubMed
    1. Carroll JS, Meyer CA, Song J, Li W, Geistlinger TR, Eeckhoute J, Brodsky AS, Keeton EK, Fertuck KC, Hall GF, et al. Genome-wide analysis of estrogen receptor binding sites. Nat Genet. 2006;38:1289–1297. - PubMed

Publication types

Associated data