. 2011 May 24;21(10):835-40.
doi: 10.1016/j.cub.2011.04.001. Epub 2011 May 5.

Notch signaling modulates sleep homeostasis and learning after sleep deprivation in Drosophila

Affiliations

Notch signaling modulates sleep homeostasis and learning after sleep deprivation in Drosophila

Laurent Seugnet et al. Curr Biol. .

Abstract

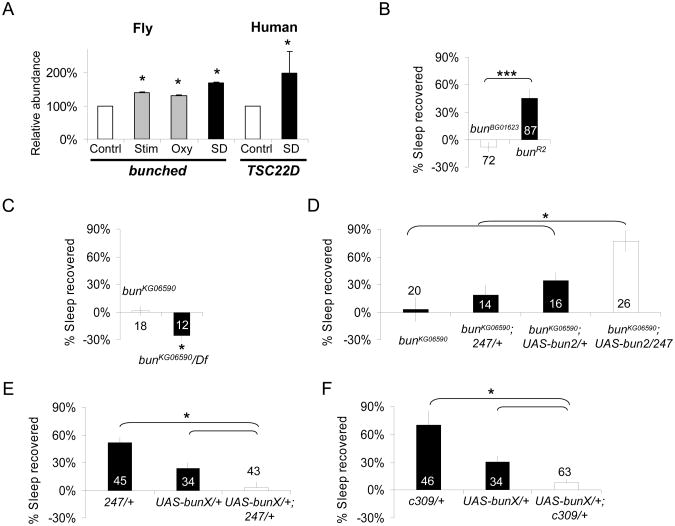
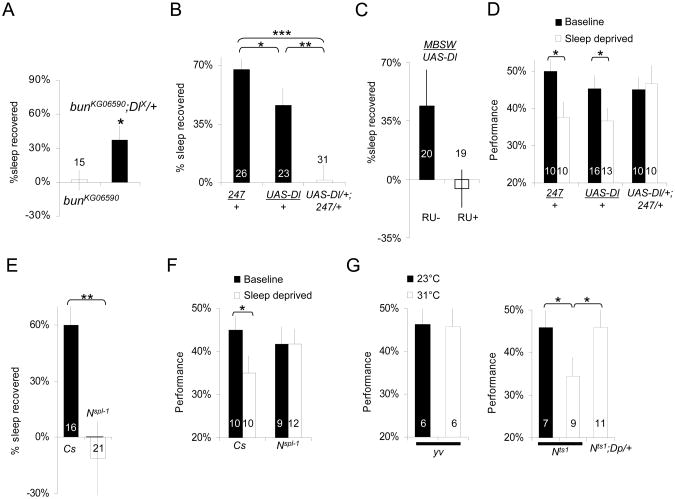
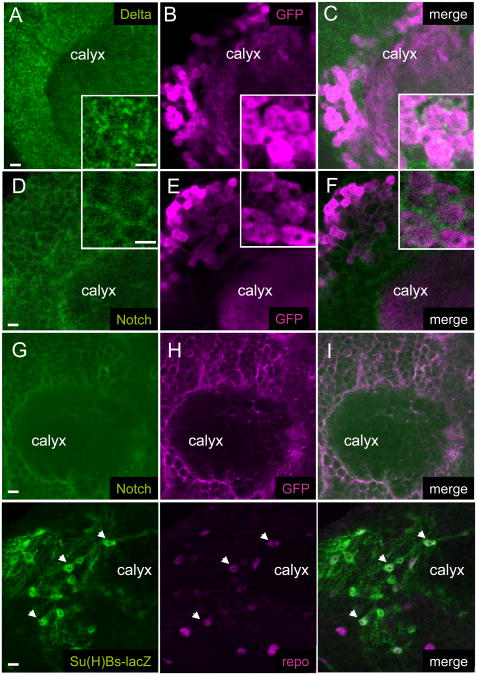
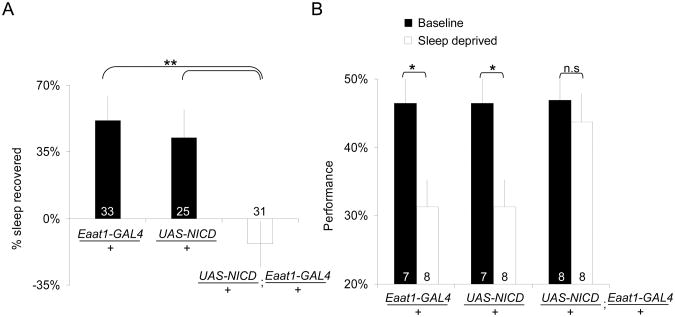
The role of the transmembrane receptor Notch in the adult brain is poorly understood. Here, we provide evidence that bunched, a negative regulator of Notch, is involved in sleep homeostasis. Genetic evidence indicates that interfering with bunched activity in the mushroom bodies (MBs) abolishes sleep homeostasis. Combining bunched and Delta loss-of-function mutations rescues normal homeostasis, suggesting that Notch signaling may be involved in regulating sensitivity to sleep loss. Preventing the downregulation of Delta by overexpressing a wild-type transgene in MBs reduces sleep homeostasis and, importantly, prevents learning impairments induced by sleep deprivation. Similar resistance to sleep loss is observed with Notch(spl-1) gain-of-function mutants. Immunohistochemistry reveals that the Notch receptor is expressed in glia, whereas Delta is localized in neurons. Importantly, the expression in glia of the intracellular domain of Notch, a dominant activated form of the receptor, is sufficient to prevent learning deficits after sleep deprivation. Together, these results identify a novel neuron-glia signaling pathway dependent on Notch and regulated by bunched. These data highlight the emerging role of neuron-glia interactions in regulating both sleep and learning impairments associated with sleep loss.


Figures

Figure 1
Figure 1. bunched is induced by sleep deprivation and regulates sleep homeostasis
(A) bunched (left) mRNA levels are increased following 12hSD (SD, dark bar), compared to untreated controls (Contrl., white bar). bunched mRNA levels are also increased following a mechanical stimulation that reduces sleep disruption (Stim., grey bar), or following a 12h of exposure to oxidative stress (Oxy., grey bar). For the stimulation control, flies received the same number of mechanical stimuli provided during sleep deprivation by exposing them to the SNAP at twice the speed for 30min every two hours for 24 hours. For oxydative stress, flies were fed 20 μM paraquat dissolved in 1% agar/5% sucrose overnight (12h). mRNA for the bunched homolog TSC22D is elevated in saliva following 28h of waking in humans (n=9; Wilcoxon signed rank test, p=.038) Each saliva sample collected after sleep deprivation was compared to a circadian matched baseline sample from the same subject. Levels are expressed as % of baseline expression. *p<.05. (B) bunBG01623 mutant flies do not display a sleep rebound following 12h of sleep deprivation, but excision of the P element in the bunR2 flies restores sleep rebound. *: p<0.05; Student's t-test. (C) bunKG06590 flies (left) show no sleep rebound after sleep deprivation. bunKG06590 crossed to the Df(2L)prd1.7(Df) covering the bunched locus also failed to show a rebound after sleep deprivation (bunKG06590/Df, black bar, left graph). *p<.05, Student's t-test. (D) Expression of a UAS-bun2 construct in the MB, using the 247-GAL4 driver is sufficient to increase sleep rebound in the bunKG06590 mutant background. ANOVA F(3,73)=8.4; p=7.18E-5. (E) and (F) Expressing a dominant negative bunched construct (UAS-bunX) in the MBs using either the 247 (E) or c309 (F) GAL4 drivers (white bars in both graphs) is sufficient to reduce sleep homeostasis compared to genetic background controls (black bars). F(2,121)=12.12; p=1.6E-05 and F(2,142)=12.65; p=8.89E-06, respectively; *p<.05 modified Bonferroni test. n is indicated in or beside each bar. mean±s.e.m is shown. See also Supplemental Figure S2 and Supplemental Table S1 for additional sleep data.
Figure 2
Figure 2. Notch regulates learning and sleep homeostasis after sleep deprivation
(A) bunKG06590 flies (white bar, left) show no sleep rebound after sleep deprivation. Combining bunKG06590 to DeltaX(DlX) rescues normal homeostatic response (bunKG06590; DlX/+, black bar). *p<.05, Student's t-test. (B) Over-expression of Delta using the MB specific driver 247 abolishes the sleep rebound (right, white bar). 247/+ and UAS-Dl/+ parental controls show a wild-type sleep homeostatic responses (black bars); F(2,77)=15.9; p=1,69E-06; *<.05, **<.005, ***<.0005 modified Bonferroni test, n is indicated in each bar. Sleep homeostasis is calculated for each individual as a ratio of the minutes of sleep gained above baseline during the 48 h of recovery divided by the total min of sleep lost during 12 h of sleep deprivation. (C) Over-expression of Delta only at the adult stage using the MB-Switch GAL4 driver. Flies were fed RU 486 (RU+) or control food (RU-) for 48h before sleep deprivation (see methods). *p<.05 Student's t-test. (D) Sleep deprivation does not disrupt learning in UAS-Dl/+;247/+ flies tested in the APS. In contrast both parental lines (247/+ and UAS-Dl/+) show learning impairments following 12 h of sleep deprivation; *<.05 modified Bonferroni test. (E) Flies bearing the gain of function Notchspl-1(Nspl-1) allele do not show a sleep homeostatic response after 12 h of sleep deprivation compared to Cs controls; *<.05 t-test. (F) Nspl-1 mutant flies (right) do not show learning impairments following 12h of sleep deprivation while Cs flies show significant impairments; *p<.05 Bonferroni test. (G) Learning is not impaired by temperature in yv control flies (left graph); 23°C (black) vs. 31°C (white) p>.05, t-test. y Notchts1v flies (Nts1, right graph) learn normally at 23°C (permissive temperature), and are impaired at 31°C (non permissive temperature). A duplication covering the Notch locus, Dp (1;2) w+51b, rescues normal learning at 31°C (Nts1; Dp/+, right bar); F(2,24)=5.9; p=0.008; *p<.05 modified Bonferroni test. n is indicated in or beside each bar. mean±s.e.m is shown. See also Supplemental Figure S2 for sleep in min/h graphs and Supplemental Table S2 for control metrics.
Figure 3
Figure 3. Notch and Delta immuno-localization in the adult brain
(A) to (I), confocal images showing the calyx, input neuropile of the MB and the surrounding neuronal cell bodies. (A) to (F) Co-labelling of Delta (A,C, green) or Notch (D,F, green) and of GFP (B,C,E,F, magenta) in 247>UAS-GFP brains to identify a subset of Kenyon cells. Insets show high magnification views of the cell body region. Delta is localized in punctae within neuronal cell bodies whereas Notch is localized primarily in the surrounding membranes. Both Notch and Delta are only weakly expressed in the calyx neuropile itself. (G) to (I) Co-labelling of Notch (green) and CD8-GFP (magenta) in a repo-GAL4>UAS-CD8-GFP brain to reveal co-localization of Notch with glial membranes. (J) to (L) Co-labelling for the Notch reporter Su(H)Bs-lacZ (green) and the glial-specific repo (localized in glial nuclei, magenta). Arrows show examples of co-localization. All Su(H)Bs-lacZ positive cells were labeled with repo. Bar: 5μm See also Supplemental Figure S3B for an overall view of the brain.
Figure 4
Figure 4. Expressing Notch intracellular domain in glial cells prevents impairments after sleep deprivation
(A) Expression of Notch intracellular domain (NICD) using the glial specific driver Eaat1-GAL4 abolishes the sleep rebound (right, white bar). Eaat1-GAL4/+ and UAS-NICD/+ genetic controls show homeostatic responses comparable to wild type flies (black bars). F(2,86)=7.35; p=0.001; **p<.005 modified Bonferroni test; n is indicated in each bar. (B) UAS-NICD/+; Eaat1-GAL4/+ flies do not show any significant impairment in learning following 12 h of sleep deprivation while performance is significantly impaired in both parental lines (Eaat1-GAL4/+ and UAS-NICD/+) after sleep loss (black vs. white); 2 way Genotype by Condition ANOVA shows main effect for condition F(1,46)=12.9; p=0.001; *p<.05 modified Bonferroni test. n is indicated in or beside each bar. mean±s.e.m is shown. See also Supplemental Table S2 for control metrics and Supplemental Figure S2 for sleep in min/h graphs.

Comment in

References

    1. Seugnet L, Suzuki Y, Thimgan M, Donlea J, Gimbel SI, Gottschalk L, Duntley SP, Shaw PJ. Identifying sleep regulatory genes using a Drosophila model of insomnia. J Neurosci. 2009;29:7148–7157. - PMC - PubMed
    1. Cirelli C, LaVaute TM, Tononi G. Sleep and wakefulness modulate gene expression in Drosophila. J Neurochem. 2005;94:1411–1419. - PubMed
    1. Dobens L, Jaeger A, Peterson JS, Raftery LA. Bunched sets a boundary for Notch signaling to pattern anterior eggshell structures during Drosophila oogenesis. Dev Biol. 2005;287:425–437. - PubMed
    1. Maret S, Dorsaz S, Gurcel L, Pradervand S, Petit B, Pfister C, Hagenbuchle O, O'Hara BF, Franken P, Tafti M. Homer1a is a core brain molecular correlate of sleep loss. Proc Natl Acad Sci U S A. 2007;104:20090–20095. - PMC - PubMed
    1. Shaw PJ, Cirelli C, Greenspan RJ, Tononi G. Correlates of sleep and waking in Drosophila melanogaster. Science. 2000;287:1834–1837. - PubMed

Publication types

MeSH terms

LinkOut - more resources