. 2011 May 24;21(10):889-96.
doi: 10.1016/j.cub.2011.04.002. Epub 2011 May 5.

The requirement for the Dam1 complex is dependent upon the number of kinetochore proteins and microtubules

Affiliations

The requirement for the Dam1 complex is dependent upon the number of kinetochore proteins and microtubules

Laura S Burrack et al. Curr Biol. .

Abstract

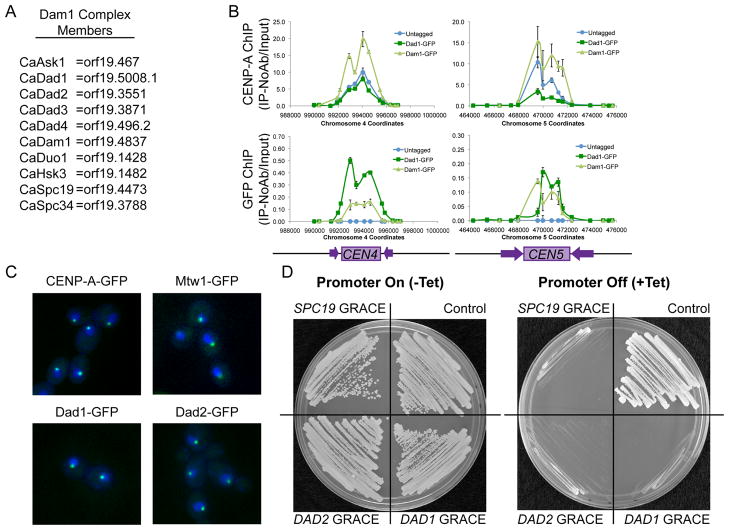
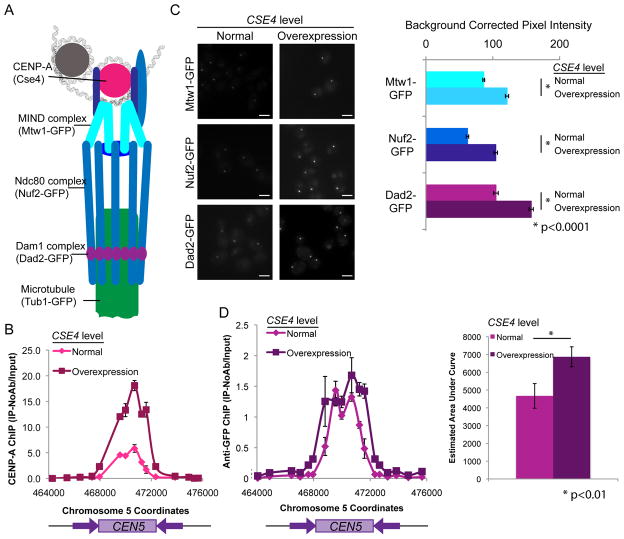
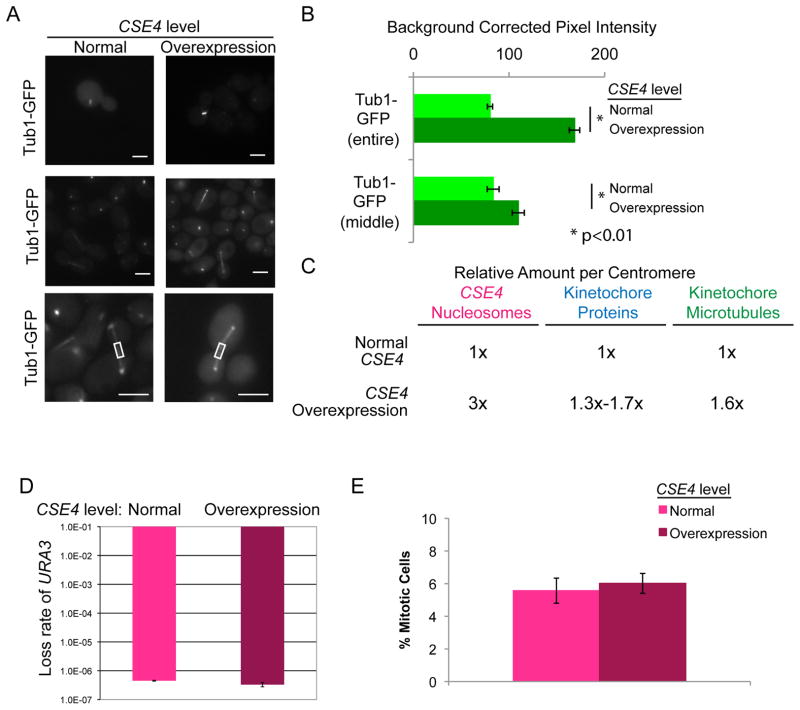
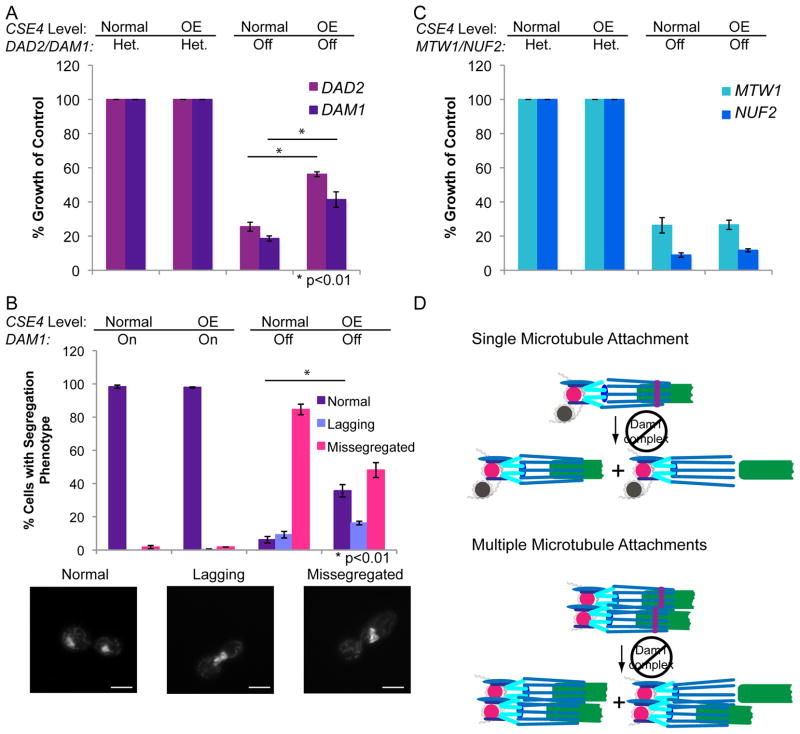
The Dam1 complex attaches the kinetochore to spindle microtubules and is a processivity factor in vitro. In Saccharomyces cerevisiae, which has point centromeres that attach to a single microtubule, deletion of any Dam1 complex member results in chromosome segregation failures and cell death. In Schizosaccharomyces pombe, which has epigenetically defined regional centromeres that each attach to 3-5 kinetochore microtubules, Dam1 complex homologs are not essential. To determine why the complex is essential in some organisms and not in others, we used Candida albicans, a multimorphic yeast with regional centromeres that attach to a single microtubule. Interestingly, the Dam1 complex was essential in C. albicans, suggesting that the number of microtubules per centromere is critical for its requirement. Importantly, by increasing CENP-A expression levels, more kinetochore proteins and microtubules were recruited to the centromeres, which remained fully functional. Furthermore, Dam1 complex members became less crucial for growth in cells with extra kinetochore proteins and microtubules. Thus, the requirement for the Dam1 complex is not due to the DNA-specific nature of point centromeres. Rather, the Dam1 complex is less critical when chromosomes have multiple kinetochore complexes and microtubules per centromere, implying that it functions as a processivity factor in vivo as well as in vitro.


Figures

Figure 1
Figure 1. C. albicans Dam1 complex proteins bind centromere DNA regions and are essential in C. albicans
(A) C. albicans Dam1 complex homologs identified by reciprocal protein-protein BLAST and Pfam family analysis (see also Table 1S). (B) ChIP with anti-CENP-A (upper panel) and anti-GFP antibodies (lower panel) at CEN4 and CEN5 DNA regions in BWP17 (untagged, blue), Dad1-GFP (dark green), and Dam1-GFP (light green) strains shows co-localization of CENP-A and Dam1 complex members on centromeric DNA. Data shown are mean ± SEM of qPCR analysis of each primer set in duplicate and are representative of 3 biological replicates. (C) GFP-tagged CENP-A, Mtw1-GFP, Dad1-GFP and Dad2-GFP (green) show similar localization patterns within DAPI-stained nuclei (blue). Cells were imaged by fluorescence microscopy at 1000x total magnification. (D) GRACE (Gene Replacement and Conditional Expression) DAD1, DAD2, or SPC19 strains and the control strain (SC5314) all exhibited robust growth on SDC-Ura media (left panel), but failed to grow when the Tet-off promoter was repressed by the addition of 50μg/ml tetracycline to SDC-Ura media (right panel).
Figure 2
Figure 2. Extra kinetochore proteins localize to centromeres when CENP-A is overexpressed
(A) Schematic of kinetochore protein organization (adapted from [18]). (B) Anti-CENP-A ChIP analyzed with primers amplifying CEN5 for CENP-A/PCK1p-CENP-A strains grown in repressing conditions (YPA-glucose - normal expression, magenta) and grown in activating conditions (YPA-succinate - overexpression, maroon) for 6 h. Data shown are mean ± SEM of each primer set in duplicate and are representative of 3 biological replicates. (C) CENP-A/PCK1p-CENP-A strains with Mtw1-GFP, Nuf2-GFP or Dad2-GFP were grown in repressing conditions (SDC-glucose - normal expression, left image panels) and grown in activating conditions (SDC-succinate- overexpression, right image panels) for 6 h. Cells were imaged at 1000X total magnification with a GFP filter set. Scale bar = 2μm. GFP fluorescence was quantified by selecting the kinetochore region in each cell and measuring total pixel intensity in the region, corrected for background fluorescence. Data shown are mean ± SEM for at least 100 cells/experiment for 3 biological replicates. Differences between normal expression of CSE4 and overexpression of CSE4 for each strain were found to be statistically significant (<0.0001) using two-tailed unpaired Student’s t-tests (*). (D) PCK1p-CSE4/CSE4 strains with Dad1-GFP were grown in repressing conditions (YPA-glucose - normal expression) and grown in activating conditions (YPA-succinate- overexpression) for 6 h. ChIP with performed with anti-GFP antibodies to assess binding of Dad1-GFP at CEN5 DNA regions. Data shown in the left panel are mean ± SEM of qPCR analysis of each primer set in duplicate and representative of 3 biological replicates. In the right panel, the mean ± SEM of the estimated area under the curve for the CEN5 region for the 3 replicates is shown. Differences between repressing and inducing conditions were found to be statistically significant (p<0.01) using a two-tailed paired Student’s t-test.
Figure 3
Figure 3. Additional spindle microtubules localize to centromeres when CENP-A is overexpressed
(A) CSE4/PCK1p-CSE4 strains with Tub1-GFP were grown in repressing conditions (SDC-glucose - normal expression, left image panels) and grown in activating conditions (SDC-succinate- overexpression, right image panels) for 6 h. Cells were imaged at 1000X total magnification with a GFP filter set. Upper panels show representative metaphase spindles and middle panels show representative anaphase spindles. Lower panels show increased magnification and example middle regions measured. Scale bar = 2μm. (B) GFP fluorescence was quantified by selecting the mitotic spindle region in each cell (upper bars) or the middle of the mitotic spindle region (lower bars) and measuring total pixel intensity in the region, corrected for background fluorescence. Data shown are mean ± SEM for at least 50 cells/experiment for 4 biological replicates. The difference in mitotic spindle GFP fluorescence between normal expression of CSE4 and overexpression of CSE4 was statistically significant (p<0.0001 for entire spindles, p<0.01 for middle of spindles) using a two-tailed unpaired Student’s t-test (*). (C) Summary of estimated number of kinetochore proteins and kinetochore-microtubule attachments with normal CSE4 expression and overexpression of CSE4. (D) Fluctuation analysis of loss of URA3 in CENP-A/PCK1p-CENP-A strains during growth in repressing conditions (YPA-glucose - normal expression) and growth in activating conditions (YPA-succinate - overexpression). Loss of URA3 was quantified by plating cells on non-selective media (YPA-Glucose) to obtain total numbers of cells and on media containing 5-FOA to select for loss of URA3. Colony counts were used to calculate the rate of FOA/cell division. Results are the mean ± standard deviation of the rates calculated from two experiments, each with 20 cultures per condition. (E) CSE4/PCK1p-CSE4 strains with Tub1-GFP were grown as in (A). The percentage of cells with mitotic spindles was counted. Data shown are mean ± SEM.
Figure 4
Figure 4. The requirement for Dam1 proteins is reduced in strains with extra kinetochore components
(A) Relative colony size was used to quantify growth of CENP-A/PCK1p-CSE4 strains in which the only copy of DAD2 or DAM1 was controlled by the MET3 promoter (right columns) compared to strains with an intact DAD2 or DAM1 allele (Het.). Strains were grown on YPA-Glucose to repress the PCK1 promoter (normal expression) and MET3 promoters and on YPA-Succinate to activate the PCK1 promoter (overexpression – OE) and repress the MET3 promoter. Colony sizes were measured after 48 h incubation. Data shown are the mean ± SEM of 4 experiments. Differences between normal CSE4 expression and CSE4 overexpression were statistically significant (p<0.01) using a two-tailed unpaired Student’s t-test (*). (B) The CENP-A/PCK1p-CSE4 MET3p-DAM1/Δdam1 strain was grown in SDC-Glucose-Met-Cys to repress the PCK1 promoter and activate the MET3 promoter, SDC-Succinate-Met-Cys to activate the PCK1 and MET3 promoters, SDC-Glucose+Met+Cys to repress the PCK1 and MET3 promoters, or SDC-Succinate+Met+Cys to activate the PCK1 promoter and repress the MET3 promoter for 6 h. Repression of PCK1 results in normal levels of CSE4, while activation results in overexpression (OE). Cells were stained with DAPI, imaged at 1000x total magnification, and chromosome segregation was analyzed. Data shown are mean ± SEM of 3 experiments. Differences between normal CSE4 expression and CSE4 overexpression when DAM1 was repressed were statistically significant (p<0.01) (*) using a two-tailed unpaired Student’s t-test. Examples of each chromosome segregation pattern are below the figure. Scale bar = 2 μm. (C) Relative colony size was used to quantify growth of CENP-A/PCK1p-CSE4 strains in which the only copy of MTW1 or NUF2 was controlled by the MET3 promoter (right columns) compared to strains with an intact MTW1 or NUF2 allele in addition to the conditionally expressed allele. Strains were grown and colony size measured as in (A). Data shown are the mean ± SEM of 3 experiments. (D) Proposed mechanism to explain the reduced requirement for Dam1 proteins when the number of kinetochore-microtubule interactions is increased. Larger numbers of spindle microtubules increase the chances that a defective attachment can be reestablished, and thus reduce the requirement for the Dam1 processivity factor.

Similar articles

Cited by

References

    1. Lampert F, Hornung P, Westermann S. The Dam1 complex confers microtubule plus end-tracking activity to the Ndc80 kinetochore complex. J Cell Biol. 2010;189:641–649. - PMC - PubMed
    1. Tien JF, Umbreit NT, Gestaut DR, Franck AD, Cooper J, Wordeman L, Gonen T, Asbury CL, Davis TN. Cooperation of the Dam1 and Ndc80 kinetochore complexes enhances microtubule coupling and is regulated by aurora B. J Cell Biol. 2010;189:713–723. - PMC - PubMed
    1. Janke C, Ortiz J, Tanaka TU, Lechner J, Schiebel E. Four new subunits of the Dam1-Duo1 complex reveal novel functions in sister kinetochore biorientation. EMBO J. 2002;21:181–193. - PMC - PubMed
    1. Li JM, Li Y, Elledge SJ. Genetic analysis of the kinetochore DASH complex reveals an antagonistic relationship with the ras/protein kinase A pathway and a novel subunit required for Ask1 association. Mol Cell Biol. 2005;25:767–778. - PMC - PubMed
    1. Cheeseman IM, Brew C, Wolyniak M, Desai A, Anderson S, Muster N, Yates JR, Huffaker TC, Drubin DG, Barnes G. Implication of a novel multiprotein Dam1p complex in outer kinetochore function. J Cell Biol. 2001;155:1137–1145. - PMC - PubMed

Publication types

MeSH terms