Review
. 2011 May 10;21(9):R346-55.
doi: 10.1016/j.cub.2011.03.015.

Evolution of abscisic acid synthesis and signaling mechanisms

Affiliations
Review

Evolution of abscisic acid synthesis and signaling mechanisms

Felix Hauser et al. Curr Biol. .

Abstract

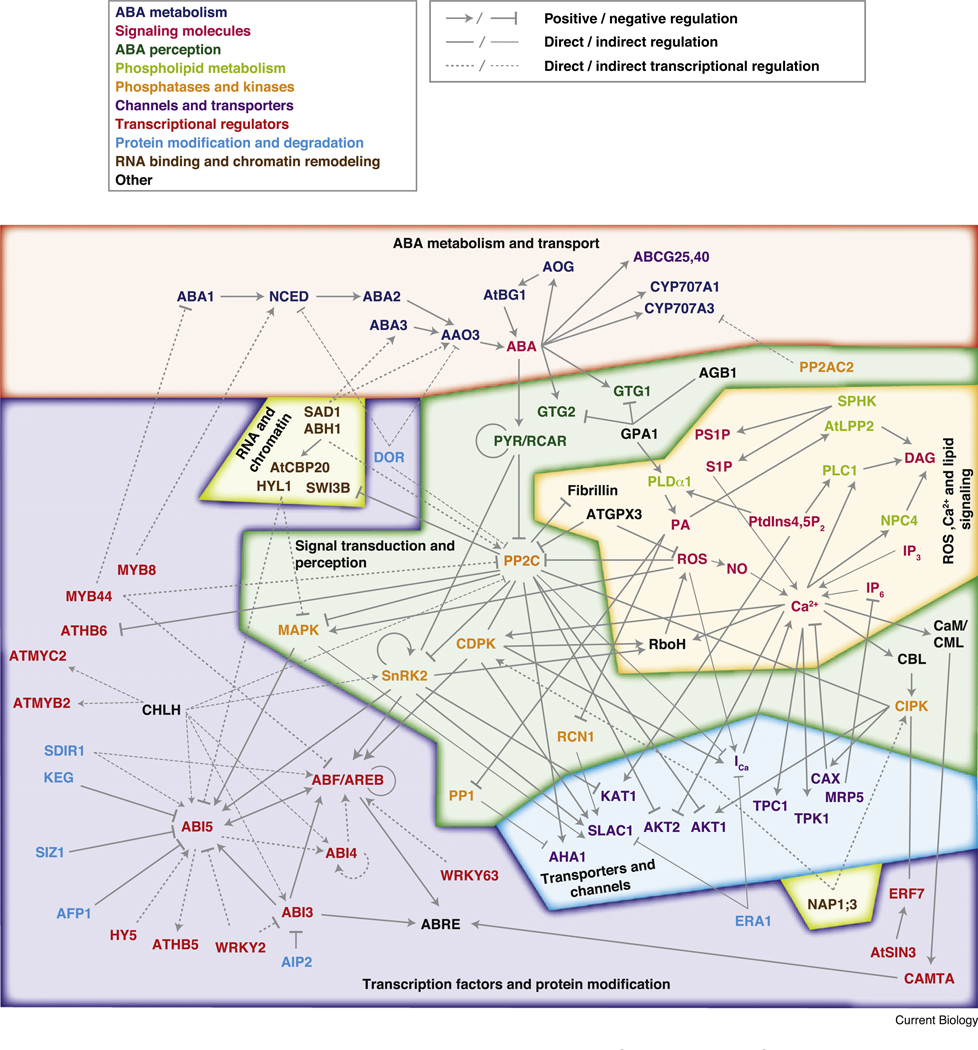
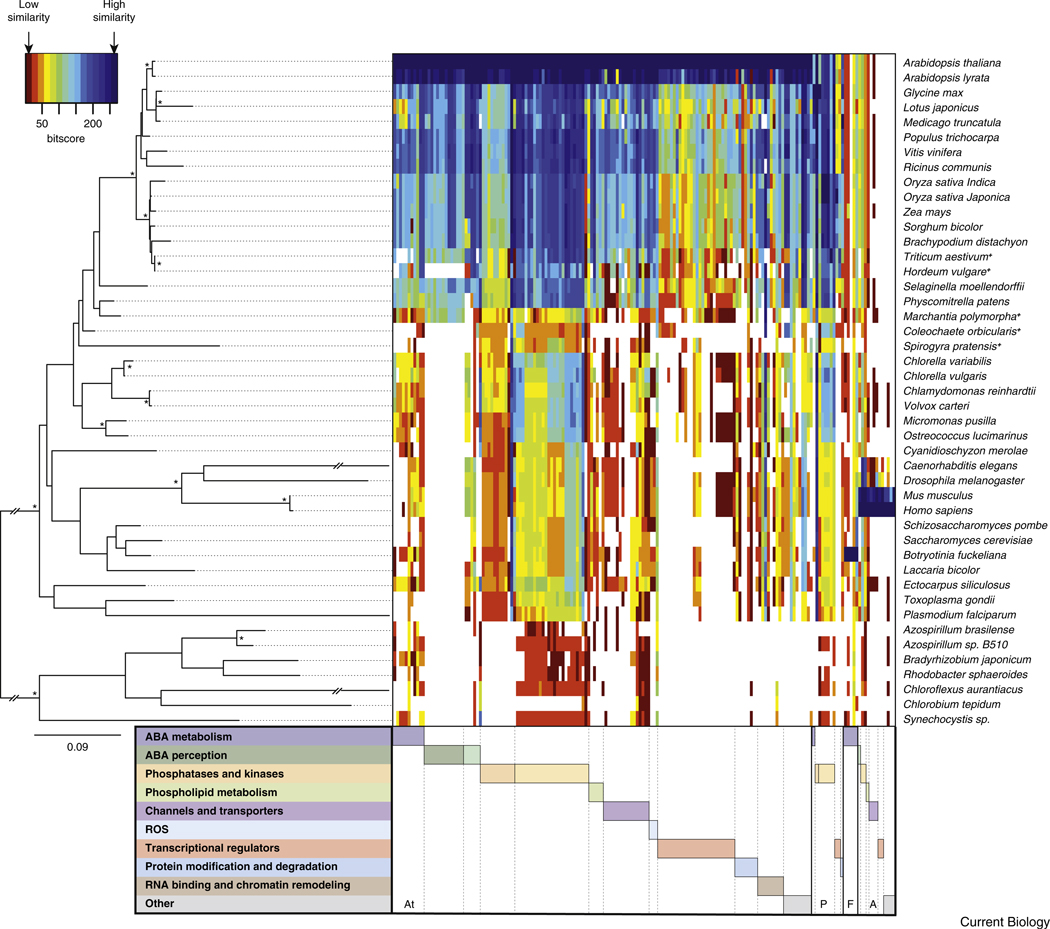
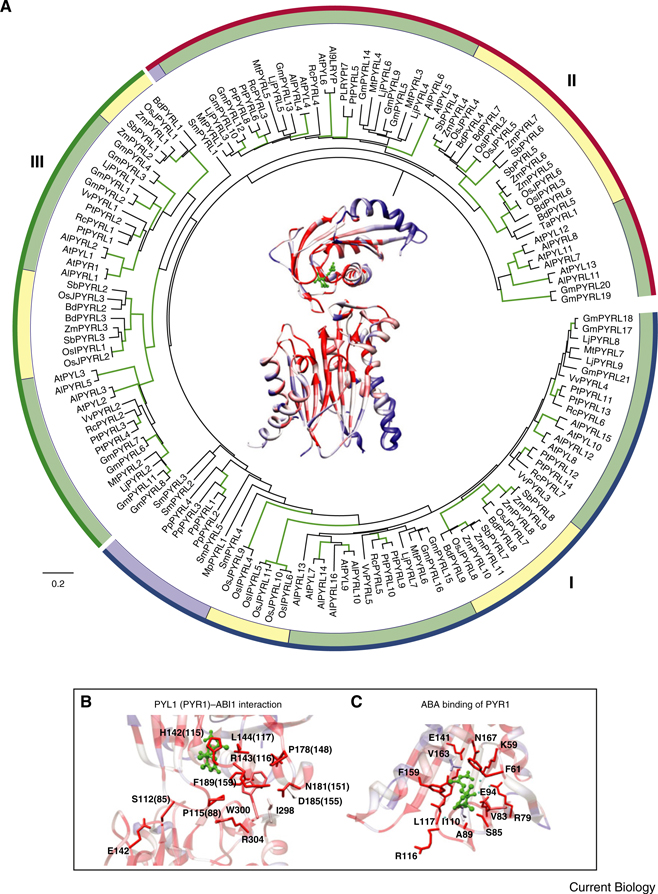
The plant hormone abscisic acid (ABA) mediates seed dormancy, controls seedling development and triggers tolerance to abiotic stresses, including drought. Core ABA signaling components consist of a recently identified group of ABA receptor proteins of the PYRABACTIN RESISTANCE (PYR)/REGULATORY COMPONENT OF ABA RECEPTOR (RCAR) family that act as negative regulators of members of the PROTEIN PHOSPHATASE 2C (PP2C) family. Inhibition of PP2C activity enables activation of SNF1-RELATED KINASE 2 (SnRK2) protein kinases, which target downstream components, including transcription factors, ion channels and NADPH oxidases. These and other components form a complex ABA signaling network. Here, an in depth analysis of the evolution of components in this ABA signaling network shows that (i) PYR/RCAR ABA receptor and ABF-type transcription factor families arose during land colonization of plants and are not found in algae and other species, (ii) ABA biosynthesis enzymes have evolved to plant- and fungal-specific forms, leading to different ABA synthesis pathways, (iii) existing stress signaling components, including PP2C phosphatases and SnRK kinases, were adapted for novel roles in this plant-specific network to respond to water limitation. In addition, evolutionarily conserved secondary structures in the PYR/RCAR ABA receptor family are visualized.


Figures

Figure 1
Figure 1. The ABA signaling network derived and inferred from curated literature listed in Supplemental Table S1
The network is divided into six main functional categories: ABA metabolism and transport (red); perception and signal transduction (dark green); ROS, Ca2+ and lipid signaling (orange); transporters and channels (blue); transcription factors and protein modification (purple); and RNA processing and chromatin remodeling (light green). ABA signaling nodes are given by their protein or molecule names and colored according to their role in ABA metabolism (dark blue); ABA perception (dark green); signaling molecules (magenta); phospholipid metabolism (light green); phosphatases and kinases (orange); channels and transporters (purple); transcriptional regulators (red); protein modification and degradation (light blue); RNA binding and chromatin remodeling (brown) and others (black). For more detailed information about the ABA signaling components please refer to the text and Supplemental Table S1 and references therein. Connections represent positive (arrow) and negative (block) regulation or currently unknown (line). Regulations are direct (bold line), indirect (faint line) or transcriptional (dashed line).
Figure 2
Figure 2. Similarity heatmap of proteins involved in ABA metabolism and signaling mechanisms
An interactive version of this figure displaying details of all proteins investigated is provided as Supplemental Figure S1. The color key (top left) represents the similarity to the closest match and ranges from dark red (low similarity) to blue (high similarity). White areas represent no hit below the e-value threshold (<10 E −10) applied. Note the absence or low similarity of many ABA signaling proteins at the transition from algae to land plants. The coloring in the heatmap is scaled column-wise based on bit values from protein blasts against genome (all) and nucleotide/EST (+) databases listed in Supplemental Table S3. Homologs of Arabidopsis (At), other plant (P), fungal (F) and animal (A) proteins are ordered according to their functional category as in Figure 1. Tools used for data analyses are listed in Supplemental Table S4. The displayed guiding tree (left) used for ordering the organisms was generated with 16S/18S rRNA sequences. Nodes labeled with an asterisk have bootstrap support greater than 95%. Scale bar indicates 0.09 substitutions per site.
Figure 3
Figure 3. Conservation of land plant PYR/RCAR ABA receptors
(A, center) Structure of PYL1 (upper part) in complex with ABI1 (lower part) (PDB: 3KDJ [75]) colored according to percent conservation in an alignment of 23 ABI1 and 149 PYR/RCAR plant homologs. The color of secondary structures changes gradually from blue (amino acid conservation ≤2%) via white (~50%) to dark red (100%). The bound ABA molecule is colored green. A maximum likelihood phylogenetic tree of PYR/RCAR homologs (PYRL) in sequenced plant genomes encircles the central PYL1–ABI1 structure. The phylogenetic tree is divided into three (I, II, III) clades according to [16] with Arabidopsis PYR/RCARs labeled red. A putative protein from Marchantia polymorpha (liverwort, MpPYRL1) probably representing the earliest identified homolog at the transition to land plants is labeled blue. Green, yellow and purple bars indicate PYRL proteins in dicots, monocots and lower plants, respectively. The underlying protein alignment and phylogenetic tree was evaluated using programs and web resources listed in Supplemental Tables S3 and S4. Branches with bootstrap confidence ≥95% are highlighted in green (100 bootstraps). The tree was rooted using Mesorhizobium loti mlr1698 as an out-group [68]. Scale bar indicates 0.2 substitutions per site. Accessions of Arabidopsis PYR/RCARs and their homologs are given in Supplemental Table S2. (B) Detailed view of the molecular contacts between PYL1 (upper part) and ABI1 (lower part) (PDB: 3KDJ [75]). Relevant amino acids and positions are given either for PYL1 or for PYR1 (parentheses). (C) Conservation of the PYR1 ABA binding pocket (PDB: 3K3K [73]). Coloring scheme in panel B and C is as described for panel A. Molecular graphics images were produced using tools described in Supplemental Table S4.

Comment in

Similar articles

Cited by

References

    1. Bruzzone S, Moreschi I, Usai C, Guida L, Damonte G, Salis A, Scarfi S, Millo E, De Flora A, Zocchi E. Abscisic acid is an endogenous cytokine in human granulocytes with cyclic ADP-ribose as second messenger. Proc. Natl. Acad. Sci. USA. 2007;104:5759–5764. - PMC - PubMed
    1. Nagamune K, Xiong L, Chini E, Sibley LD. Plants, endo-symbionts and parasites: Abscisic acid and calcium signaling. Commun. Integr. Biol. 2008;1:62–65. - PMC - PubMed
    1. Hartung W. The evolution of abscisic acid (ABA) and ABA function in lower plants, fungi and lichen. Funct. Plant Biol. 2010;37:806–812.
    1. Finkelstein R, Reeves W, Ariizumi T, Steber C. Molecular aspects of seed dormancy. Annu. Rev. Plant Biol. 2008;59:387–415. - PubMed
    1. Xiong L, Wang RG, Mao G, Koczan JM. Identification of drought tolerance determinants by genetic analysis of root response to drought stress and abscisic acid. Plant Physiol. 2006;142:1065–1074. - PMC - PubMed

Publication types

MeSH terms