. 2011 May 6;332(6030):726-9.
doi: 10.1126/science.1199884.

Relationship between clinical signs and transmission of an infectious disease and the implications for control

Affiliations

Relationship between clinical signs and transmission of an infectious disease and the implications for control

Bryan Charleston et al. Science. .

Erratum in

  • Science. 2011 Jun 10;332(6035):1263

Abstract

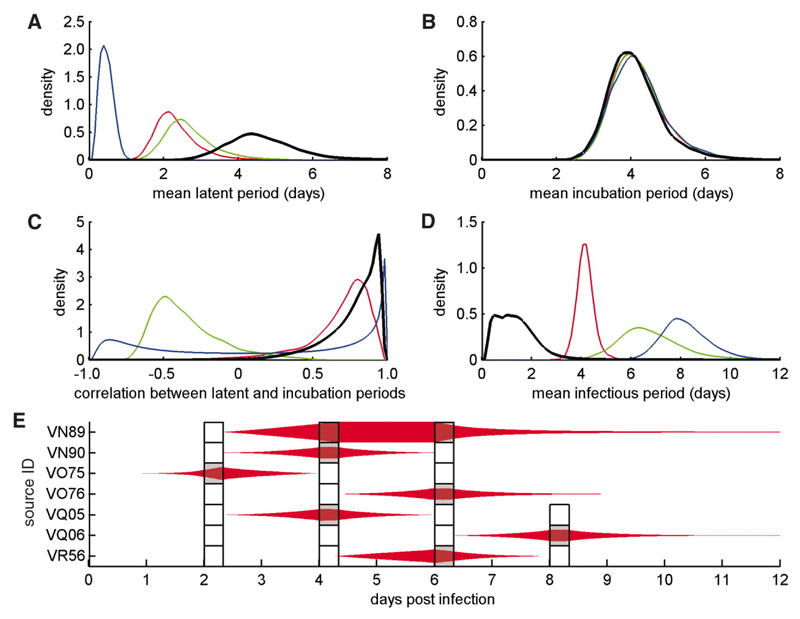
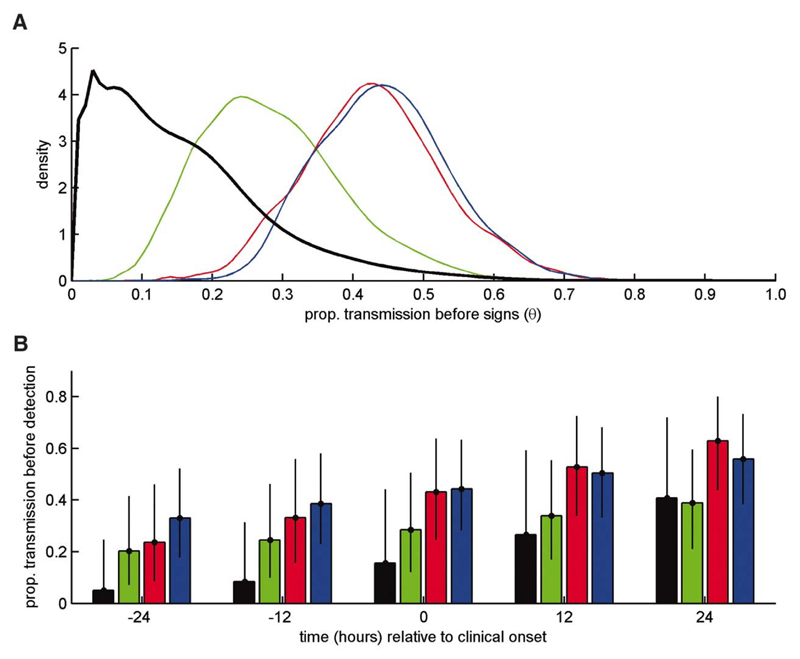
Control of many infectious diseases relies on the detection of clinical cases and the isolation, removal, or treatment of cases and their contacts. The success of such "reactive" strategies is influenced by the fraction of transmission occurring before signs appear. We performed experimental studies of foot-and-mouth disease transmission in cattle and estimated this fraction at less than half the value expected from detecting virus in body fluids, the standard proxy measure of infectiousness. This is because the infectious period is shorter (mean 1.7 days) than currently realized, and animals are not infectious until, on average, 0.5 days after clinical signs appear. These results imply that controversial preemptive control measures may be unnecessary; instead, efforts should be directed at early detection of infection and rapid intervention.


Figures

Figure 1
Figure 1
Nonmetric multidimensional scaling (NMS) ordination of transmission data. The NMS final solution was two dimensional and explained 86.1% of the variation in FMD transmission success. Correlations between variables used (see Table S2) and NMS scores are shown in Fig. S1. (A) Blue circles represent days when transmission occurred, red circles when no transmission occurred and green open circles when transmission was not attempted. Ellipses indicate the mean ±1 standard deviation bivariate interval for successful and unsuccessful transmission attempts only. (B) Ellipses indicate the mean ±1 standard deviation bivariate interval for each day, where Day P is the day of peak NMS axis 1 score. Days ≥P+2 and ≤P-2 have been grouped.
Figure 2
Figure 2
Bayesian analysis of FMDV transmission data. (A-D) Marginal posterior densities for the mean duration (in days) of the (A) latent and (B) incubation periods, (C) the correlation between the latent and incubation periods, and (D) the infectious period. Results for the analysis based on transmission attempt outcome only (black lines) were compared with results for virus isolation from nasal fluid (NF) (green lines), blood (red lines) or oesophageal-pharyngeal fluid (OPF) (blue lines). There were significant (p<0.05) differences for latent period (blood and OPF), latent period minus incubation period (blood and OPF), their correlation (NF), and infectious period (NF, blood and OPF). (E) Posterior estimates for the (unobserved) latent and infectious periods in relation to the experimental transmission attempts (indicated by boxes marked grey if the attempt was successful and white if it was not). The thickness of the red shapes indicates the proportion of Markov chain Monte Carlo samples for which an animal was infectious at that time (with the symbol occupying the full width of the box if it was infectious for all samples). Cow VR57 was excluded from these analyses as, though infected, it was apparently never infectious.
Figure 3
Figure 3
Implications of results for detection and control of FMDV. (A) Marginal posterior density for the proportion of transmission that occurs before the onset of clinical signs, θ. (B) Posterior means (bars) and 95% credible intervals (error bars) for the proportion of transmission that occurs before detection assuming infected animals are detected at -24, -12, 0, +12 or +24 hrs relative to the onset of clinical signs. In each plot results are shown for the analysis based on transmission attempt outcome only (black) and virus isolation from nasal fluid (green), blood (red) or oesophageal-pharyngeal fluid (blue).

Similar articles

Cited by

References

    1. See WHO Factsheets, http://www.who.int/mediacentre/factsheets/en/ (accessed 01/10/10) and OIE Animal diseases data, http://www.oie.int/eng/maladies/entech_cards.htm (accessed 04/10/10)

    1. Zinsstag J, Weiss MG. Science. 2001;294:477. - PubMed
    1. Tracey CS, Rea E, Upshur REG. BMC Public Health. 2009;9:470. - PMC - PubMed
    1. Fraser C, Riley S, Anderson RM, Ferguson NM. Proc Natl Acad Sci U S A. 2004;101:6146. - PMC - PubMed
    1. Scott GR. Rinderpest and Peste des Petits Ruminants In: Virus Diseases of Food Animals. In: Gibbes EPJ, editor. Vol. 2 Academic Press; MO, USA: 1981.

Publication types

MeSH terms

Substances