. 2011 Jul 1;22(13):2198-211.
doi: 10.1091/mbc.E10-12-0937. Epub 2011 May 5.

The LRRK2-related Roco kinase Roco2 is regulated by Rab1A and controls the actin cytoskeleton

Affiliations

The LRRK2-related Roco kinase Roco2 is regulated by Rab1A and controls the actin cytoskeleton

Sebastian Kicka et al. Mol Biol Cell. .

Abstract

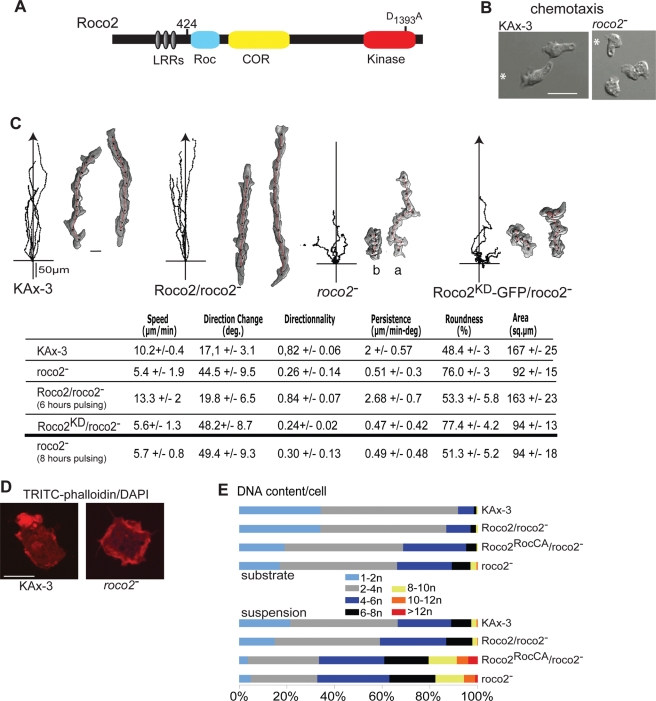
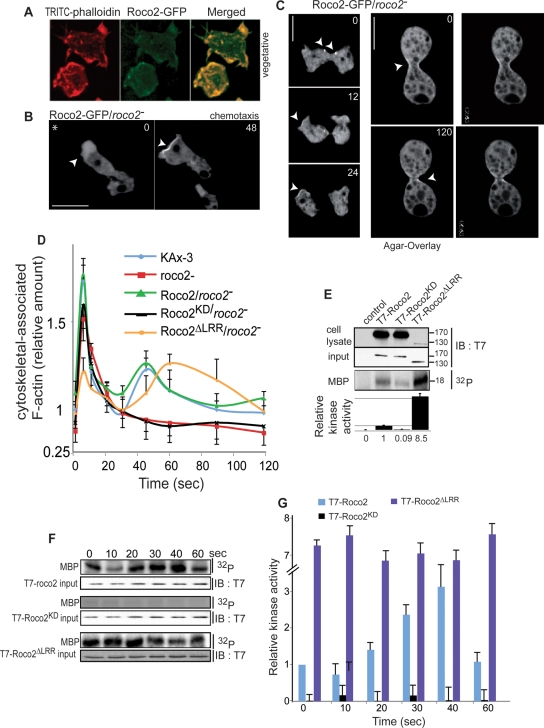
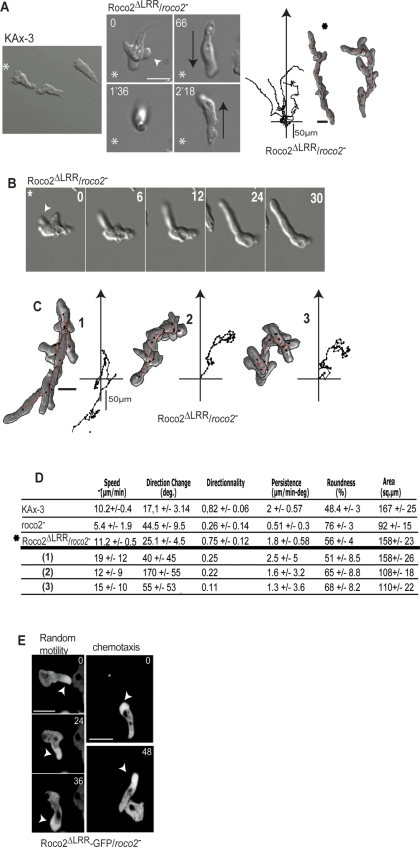
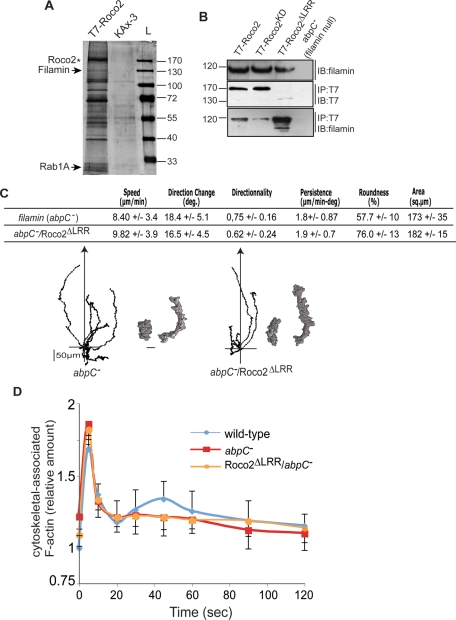
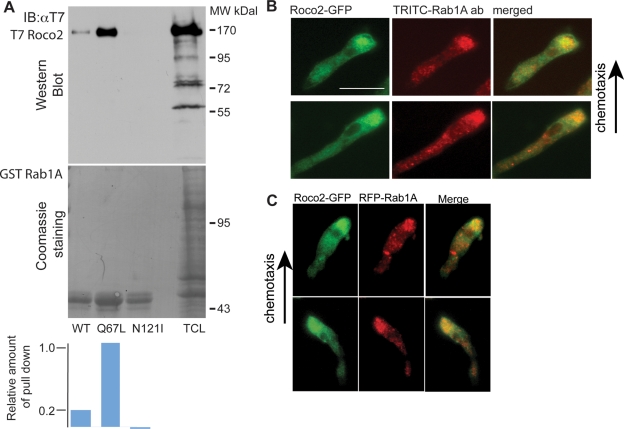
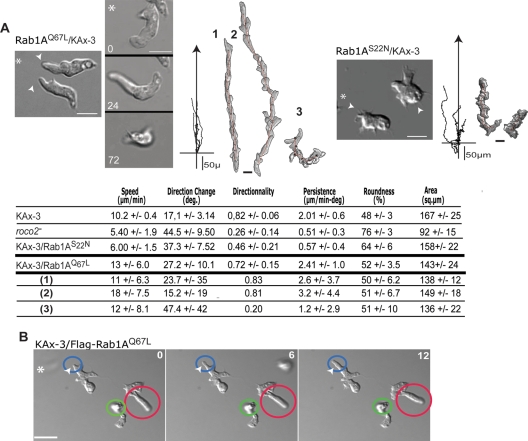
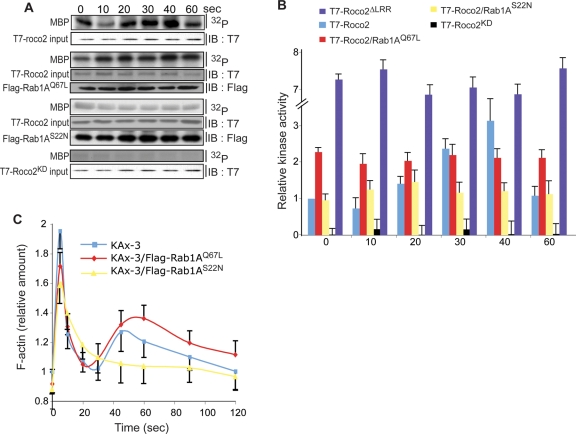
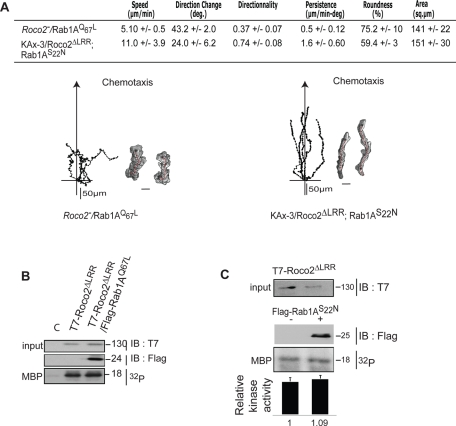
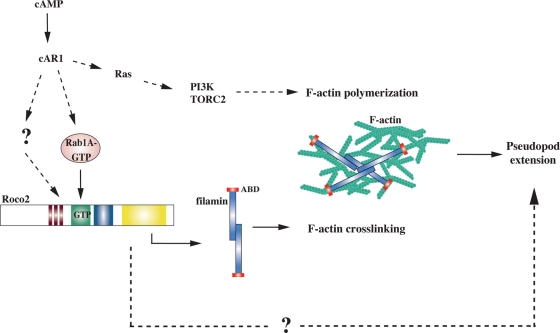
We identify a new pathway that is required for proper pseudopod formation. We show that Roco2, a leucine-rich repeat kinase 2 (LRRK2)-related Roco kinase, is activated in response to chemoattractant stimulation and helps mediate cell polarization and chemotaxis by regulating cortical F-actin polymerization and pseudopod extension in a pathway that requires Rab1A. We found that Roco2 binds the small GTPase Rab1A as well as the F-actin cross-linking protein filamin (actin-binding protein 120, abp120) in vivo. We show that active Rab1A (Rab1A-GTP) is required for and regulates Roco2 kinase activity in vivo and that filamin lies downstream from Roco2 and controls pseudopod extension during chemotaxis and random cell motility. Therefore our study uncovered a new signaling pathway that involves Rab1A and controls the actin cytoskeleton and pseudopod extension, and thereby, cell polarity and motility. These findings also may have implications in the regulation of other Roco kinases, including possibly LRRK2, in metazoans.


Figures

FIGURE 1:
FIGURE 1:
(A) Domain structure of the Roco2 protein, the LRRs, a COR, and a ROC (Ras of complex protein) domain as defined by Bosgraaf and van Haastert (2003), and a kinase domain sharing similarity to MEKKs. The mutation created is indicated. (B) Images of chemotaxing wild-type and roco2 cells. (C) Trajectories of cells migrating to the chemoattractant cAMP emitted from a micropipette and images of chemotaxing cells taken at 1-min intervals obtained using DIAS software (Wessels et al., 1998). Wild-type, roco2, GFP-Roco2/roco2, and GFP-Roco2KD/roco2 cells are analyzed. For roco2 cells, two cells at different distances from the needle are shown: (a) a cell ∼400 μm from the needle; (b) a cell ∼10–150 μm from the needle. Table, DIAS computer analysis performed on time-lapse DIC microscopy movies with a 40× objective of cells chemotaxing to cAMP. Speed represents movement of a cell's centroid; change of direction (degrees) is a relative measure of the number and frequency of turns made by the cell. Higher numbers indicate more turns and a less efficient chemotaxis. Directionality is a measure of straightness of cell movement. Persistence is an indirect measure of straightness of cell movement to the chemoattractant source; it is the value divided by direction change values. Lower numbers indicate a less efficient chemotaxis. Roundness is an indication of the cell polarity. Larger numbers indicate the cells are more round and less polarized. (D) KAx-3 and roco2 cells stained with the F-actin marker TRITC-phalloidin. (E) The relative DNA content of DAPI-stained log-phase cells as determined by FACS. Scale bars: 10 μm.
FIGURE 2:
FIGURE 2:
Analysis of roco2 cells. (A) Confocal microscopy images of vegetative GFP-Roco2/roco2 cells fixed and stained with TRITC-phalloidin. (B) Confocal fluorescent images of chemotaxing Roco2-GFP/roco2 cells. Arrows indicate an enrichment of roco2-GFP at the cell's leading edge. (C) Left, confocal fluorescent microscopy images of dividing Roco2-GFP/roco2 cells. Arrows indicate Roco2-GFP appearing on cell poles in late cytokinesis. Right, confocal fluorescent microscopy images of Roco2-GFP/roco2 cells using the “agar-overlay” method. Arrows indicate the cleavage furrow enriched with Roco2-GFP. (D) Kinetics of F-actin polymerization in response to chemoattractant stimulation. (E) Basal Roco2 kinase activity in 6 h pulsed cells. Top, immunoblot and autoradiogram of MBP phosphorylation by Roco2, as resolved by SDS–PAGE. Roco2 protein levels were determined by Western blot analysis, using anti-T7 antibody. Bottom, normalization of incorporated 32P compared with Roco2 protein content. Data are representative of at least three independent experiments, in arbitrary units, where wild-type-Roco2 kinase activity is defined as 1.0. (F) Kinase activity of Roco2, Roco2KD, and Roco2ΔLRR expressed in roco2 cells upon cAMP stimulation of 6 h pulsed cells as described in Materials and Methods. Because Roco2ΔLRR is expressed at a much lower level than wild-type Roco2, the immunoblot to quantify Roco2 protein was exposed for a longer time than the other Western blots. Kinase activity was quantitated using a phosphorimager. (G) Quantitation of kinase activity.
FIGURE 3:
FIGURE 3:
Analysis of Roco2ΔLRR chemotaxis. (A) DIC images of chemotaxing wild-type and Roco2ΔLRR cells and Roco2ΔLRR cells trajectories. Asterisk, position of the micropipette; black arrows, cell direction; white arrow, nascent pseudopod. (B) Time-lapse images of the formation of an extended pseudopod in Roco2ΔLRR/roco2 cells. (C) Trajectories of adhesive Roco2ΔLRR cells, individual cells in which the pseudopod is not associated with the substrate and is in within the plane of focus (designated as “floating” cells). These cells are labeled 1, 2, and 3, and DIAS analysis of the cells is provided in part (D). (D) DIAS computer analysis performed on time-lapse DIC microscopy as described previously (Wessels et al., 1998). (E) Fluorescent images of confocal microscopy of Roco2ΔLRR-GFP/roco2 cells randomly moving (left panels) or migrating toward a chemoattractant source (right panels). The arrow points to a cell exhibiting a smooth pseudopod.
FIGURE 4:
FIGURE 4:
Roco2-associated proteins. (A) Roco2-associated proteins were coimmunoprecipitated from T7-Roco2 aggregation-competent cells, separated on an acrylamide gel, and detected by silver nitrate staining. Wild-type KAx-3 cells were treated similarly and used as a control. T7-Roco2 band (asterisk) is indicated as well as filamin/ABP120 and Rab1A (arrows). (B) Coimmunoprecipitation assay results from cells transformed with plasmids expressing T7-tagged Roco2 (wild-type, kinase-dead, or Roco2ΔLRR). Protein extracts were precipitated with anti-T7 antibody and were subjected to a Western blotting analysis using either anti-T7 or an anti-filamin antibody. (C) Chemotaxis of filamin (abpC)-null cells and abpC cells expressing Roco2ΔLRR. The two tracings show a cell closer to (left) and further away (right) from the needle. (D) Kinetics of chemoattractant-induced F-actin polymerization in abpC cells and abpC cells expressing Roco2ΔLRR.
FIGURE 5:
FIGURE 5:
Roco2 associates with Rab1A. (A) Pull-down assay results from roco2 cells expressing T7-tagged Roco2 using recombinant, GST-fused wild-type Rab1A, Rab1AN121I, and Rab1AQ67L, as described in Materials and Methods. Quantification of the data is shown at the bottom. (B) Confocal microscopy images of fixed chemotaxing roco2 cells expressing Roco2-GFP costained for endogenous Rab1A with α-Rab1A. (C) In vivo images of chemotaxing roco2 cells expressing Roco2-GFP and RFP-Rab1A. Images were taken 12 s apart. Scale bars: 10 μm.
FIGURE 6:
FIGURE 6:
DIC images, cell trajectories, and DIAS computer analysis of chemotaxing KAx-3 cells expressing either FLAG-Rab1AQ67L (A) or FLAG-Rab1AS22N (B). In (A), the trajectories of three cells are shown: two of the cells (1, 2) exhibited good anterior adherence during the time of the plots, while cell 3 exhibited poor anterior adherence. (C) DIAS computer analysis. (D) Occurrence of a greatly extended leading edge in wild-type cells expressing FLAG-Rab1AQ67L. The pseudopodial protrusions are highlighted by a colored circle. The red circle shows an already extended pseudopod. The blue circle indicates a newly forming pseudopod. The green circle identifies a pseudopod that is extended upward, out of the plane of focus.
FIGURE 7:
FIGURE 7:
Effect of Rab1A on Roco2 function. (A) Top, immunoblot and autoradiogram of MBP phosphorylation by Roco2 upon cAMP stimulation. Western blot analysis was used to determine Roco2 protein levels (anti-T7 antibody) and Rab1A protein levels (anti-FLAG antibody). (B) Normalization of incorporated 32P compared with Roco2 protein content. Data are representative of at least three independent experiments, in arbitrary units, where wild-type-Roco2 kinase activity prior to cAMP stimulation is defined as 1 (t = 0). Data for Roco2ΔLRR and Roco2KD are shown for comparison. (C) Kinetics of F-actin polymerization in response to chemoattractant stimulation in KAx-3 cells expressing either FLAG-Rab1AS22N or FLAG-Rab1AQ67L.
FIGURE 8:
FIGURE 8:
Effect of coexpressing Rab1A mutants on the chemotaxis phenotype of Roco2 mutant strains. (A) Chemotaxis of roco2 cells expressing Rab1AQ67L and roco2 cells coexpressing GFP-Roco2ΔLRR and FLAG- Rab1AS22N. Scale bar: 10 μm for cell images. Coexpression of Rab1AQ67L (B) or Rab1AS22N (C) with Roco2ΔLRR in roco2 cells does not affect Roco2ΔLRR kinase activity. The average of the kinase activity from three sets of cells is shown with the average for wild-type cells set at 1.0. Error bars give the SD.
FIGURE 9:
FIGURE 9:
Model for Roco2 regulation of pseudopod extension. The chemoattractant cAMP, through the GPCR cAR1, activates multiple signaling pathways that lead to F-actin polymerization, including Ras-mediated activation of PI3K and TORC2. We provide evidence that chemoattractant-mediated Roco2 activation requires Rab1A-GTP and this functions to control pseudopod extension by regulating filamin. We expect Roco2 activation requires GTP binding to the ROC domain as with other Roco family members. Roco2 may have inputs in addition to Rab1A that directly regulate its activation downstream from the receptor and heterotrimeric G proteins. Our results also do not exclude that Roco2 functions to control pseudopod extension via other effectors in addition to filamin. We suggest that the control of pseudopod extension is independent of pathways that directly control localized F-actin polymerization. We expect that, but do not know whether, chemoattractant stimulation leads to Rab1A activation. ABD, F-actin binding domain of filamin.

Similar articles

Cited by

References

    1. Abe T, Langenick J, Williams JG. Rapid generation of gene disruption constructs by in vitro transposition and identification of a Dictyostelium protein kinase that regulates its rate of growth and development. Nucleic Acids Res. 2003;31:e107. - PMC - PubMed
    1. Abysalh JC, Kuchnicki LL, Larochelle DA. The identification of pats1, a novel gene locus required for cytokinesis in Dictyostelium discoideum. Mol Biol Cell. 2003;14:14–25. - PMC - PubMed
    1. Alvarez C, Garcia-Mata R, Brandon E, Sztul E. COPI recruitment is modulated by a Rab1b-dependent mechanism. Mol Biol Cell. 2003;14:2116–2127. - PMC - PubMed
    1. Bandala-Sanchez E, Annesley SJ, Fisher PR. A phototaxis signalling complex in Dictyostelium discoideum. Eur J Cell Biol. 2006;85:1099–1106. - PubMed
    1. Baldassarre M, Razinia Z, Burande CF, Lamsoul I, Lutz PG, Calderwood DA. Filamins regulate cell spreading and initiation of cell migration. PLoS One. 2009;4:e7830. - PMC - PubMed

Publication types

MeSH terms

LinkOut - more resources