. 2011 Jul 1;22(13):2324-36.
doi: 10.1091/mbc.E11-02-0159. Epub 2011 May 5.

Release mode of large and small dense-core vesicles specified by different synaptotagmin isoforms in PC12 cells

Affiliations

Release mode of large and small dense-core vesicles specified by different synaptotagmin isoforms in PC12 cells

Zhen Zhang et al. Mol Biol Cell. .

Abstract

Many cells release multiple substances in different proportions according to the specific character of a stimulus. PC12 cells, a model neuroendocrine cell line, express multiple isoforms of the exocytotic Ca(2+) sensor synaptotagmin. We show that these isoforms sort to populations of dense-core vesicles that differ in size. These synaptotagmins differ in their Ca(2+) sensitivities, their preference for full fusion or kiss-and-run, and their sensitivity to inhibition by synaptotagmin IV. In PC12 cells, vesicles that harbor these different synaptotagmin isoforms can be preferentially triggered to fuse by different forms of stimulation. The mode of fusion is specified by the synaptotagmin isoform activated, and because kiss-and-run exocytosis can filter small molecules through a size-limiting fusion pore, the activation of isoforms that favor kiss-and-run will select smaller molecules over larger molecules packaged in the same vesicle. Thus synaptotagmin isoforms can provide multiple levels of control in the release of different molecules from the same cell.


Figures

FIGURE 1:
FIGURE 1:
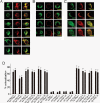
Localization of syt isoforms on DCVs by immunogold electron microscopy. (A) Sample images for syt I, VII, IX, and IV localization. Distributions of diameters of DCVs labeled with gold particles coupled to syt I–pHluorin (B), syt VII-pHluorin (C), syt IX–pHluorin (D), and syt IV–pHluorin (E) show that syt isoforms target DCVs of different sizes. Each distribution was fitted to a Gaussian function. (F) The mean diameter determined as the peak of the distribution differs significantly between all pairs except syt IV and syt IX. (G) DCV sizes were not changed by overexpression of syt isoforms. (H) Diagram summarizing the DCV size preferences of syt isoforms. From 178 to 374 DCVs were measured for each syt isoform. Error bars represent SEM; ***p < 0.001.
FIGURE 2:
FIGURE 2:
Norepinephrine release and liposome fusion triggered by divalent cations. (A) Sample amperometric spikes triggered by Ca2+, Sr2+, and Ba2+. (B) Total spike areas differed for each divalent cation. (C) Distributions of spike areas for each metal. The different positions of the peaks parallel the different means in B. (D) syt I, VII, and IX differed in their stimulation of liposome fusion in response to 1 mM Ba2+. (E) Plot of fusion vs. [Ba2+] for each isoform. (F, G) As in D and E, but with Sr2+. (H, I) As in D and E, but with Ca2+. (J) Diagram depicting the localization of syt isoforms on DCVs with various sizes from Figure 1 and DCVs for which exocytosis can be triggered by distinct divalent cations. For amperometry 320–1083 spikes were recorded from 62–80 cells, and for fusion assays at least three independent experiments were performed for each divalent cation. Error bars represent SEM; **p < 0.01; ***p < 0.001.
FIGURE 3:
FIGURE 3:
Protein–protein colocalization. (A) Fluorescence micrographs show colocalization of syt isoforms with one another. Each row shows localization of two different isoforms (left and center) together with colocalization as an overlay of the two images (right). (B) Colocalization of syt isoforms with syntaxin (syx). Each row shows syt isoform (left), syntaxin (center), and an overlay (right). (C) Colocalization of syt isoforms with chromogranin B (Cg II). Each row shows a syt isoform (left), Cg II (center), and an overlay (right). (D) Quantitative measures of colocalization were determined using ImageJ (see Materials and Methods) by analyzing overlay images such as shown in A–C, right. *p < 0.05 for syt I/syt VII against all other syt pairs except syt VII/syt I. All plotted values were based on three or more experiments.
FIGURE 4:
FIGURE 4:
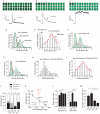
Total internal reflection fluorescence changes during exocytosis. (A–C) Three sample traces of unitary release events, with a sequence of images (at 100-ms intervals) from the release site above and fluorescence in these 1- to 2-μm regions of interest below. The examples shown from a PC12 cell transfected with syt I–pHluorin (A and B) and from a PC12 cell transfected with syt VII–pHluorin (C) show strikingly different time courses. (D) Decay times were determined from the fluorescence traces from PC12 cells transfected with syt I–pHluorin. The distribution of decay times revealed two peaks. (E) Decay-time distribution for cells transfected with syt VII–pHluorin shows longer decay times with only a few fast events corresponding to the peak at brief times in D. (F, G) Decay time distribution for cells transfected with syt IX–pHluorin and syt IV–pHluorin, respectively. (H) Decay-time distribution from syt I-pHluorin–transfected cells in 100 mM HEPES shows that the fast component of decay times seen in 10 mM HEPES became slower. (I) High HEPES similarly eliminated the small number of rapidly decaying events in cells transfected with syt VII–pHluorin but did not shift the peak at slowly decaying times. (J) Events were classified according to decay time as kiss-and-run (decay time <2 s), full fusion (decay time finite but >2 s), or persistent (no apparent decay), and the percentages were plotted for the different isoforms. syt VII produced the fewest kiss-and-run events, syt IX had an intermediate number, and syt I and syt IV produced the most. (K) The effect of the positive regulators of exocytosis (syt I, VII, and IX) on kiss-and-run decreased with the diameter of DCVs harboring that isoform (from Figure 1). The negative regulator (syt IV) fell off the fitted line for the positive regulators. (L) Mean decay times of kiss-and-run events and full-fusion events for each isoform. (M) Mean secretion rate (events/minute) from PC12 cells transfected with each syt isoforms. From 53 to 131 events were used for decay time analysis and 87–262 events for secretion rate analysis for recordings from 7–19 cells. Error bars represent SEM. *p < 0.05; **p < 0.01; ***p < 0.001.
FIGURE 5:
FIGURE 5:
Different release modes in syt I-bearing DCVs. (A) A size diagram for DCV exocytosis triggered by different divalent cations. Distributions of TIRF decay times of syt I-pHluorin–transfected cells were plotted for release triggered by Sr2+ (B) and Ba2+ (C) (note that the corresponding plot for Ca2+ is shown in Figure 4D). Distributions showed two peaks with different areas. Percent of events that are kiss-and-run (D), rapid and slow decay times (E), and secretion rate (F) for exocytosis triggered by Ca2+, Sr2+, and Ba2+, using syt I–pHluorin signals. From 56 to 131 events were used for decay time analysis and 56–218 events for secretion rate analysis for recordings from 8–14 cells for each divalent cation. Error bars represent SEM. *p < 0.05.
FIGURE 6:
FIGURE 6:
The effect of syt IV on fusion in liposomes bearing distinct syt isoforms. (A–C) syt IV inhibited syt I–, syt VII–, and syt IX–mediated liposome fusion in vitro. (D) The dependence of inhibition of fusion on syt IV concentration. At least four independent experiments were performed for in vitro fusion assays.
FIGURE 7:
FIGURE 7:
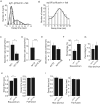
The effect of syt IV induction on exocytosis. Cells were treated with forskolin to induce syt IV and transfected with syt–pHluorin constructs so that exocytosis could be studied with TIRF. (A) syt I–pHluorin events decayed with varying rates, and the decay time distribution revealed two peaks corresponding to kiss-and-run and full fusion (compare with Figure 4D). (B) syt VII–pHluorin events had a decay time distribution similar to that in syt VII-pHluorin–transfected cells without forskolin treatment (Figure 4E). Forskolin treatment reduced the secretion rate of syt I-pHluorin–bearing DCVs (C) and syt IX-pHluorin–bearing DCVs (D) but not syt VII–bearing DCVs (E). Forskolin increased the percentage of syt I–pHluorin events that were kiss-and-run (F) but had no significant effect on the kiss-and-run percentage with syt VII–bearing DCVs (G). (H) Forskolin treatment induced a small but statistically significant increase in the fast decay time of syt I–pHluorin events but produced no change in the slow decay time. (I) Forskolin treatment failed to alter the percentage of kiss-and-run events or decay times of syt VII–bearing vesicles. From 78 to 131 events were used for decay time analysis and 3–262 events for secretion rate analysis for recordings from 8–19 cells. Error bars represent SEM. *p < 0.05; ***p < 0.001.

Similar articles

Cited by

References

    1. Ahras M, Otto GP, Tooze SA. Synaptotagmin IV is necessary for the maturation of secretory granules in PC12 cells. J Cell Biol. 2006;173:241–251. - PMC - PubMed
    1. Alvarez de Toledo G, Fernandez-Chacon R, Fernandez JM. Release of secretory products during transient vesicle fusion. Nature. 1993;363:554–558. - PubMed
    1. Ariga T, Macala LJ, Saito M, Margolis RK, Greene LA, Margolis RU, Yu RK. Lipid composition of PC12 pheochromocytoma cells: characterization of globoside as a major neutral glycolipid. Biochemistry. 1988;27:52–58. - PubMed
    1. Atluri PP, Ryan TA. The kinetics of synaptic vesicle reacidification at hippocampal nerve terminals. J Neurosci. 2006;26:2313–2320. - PMC - PubMed
    1. Augustine GJ. How does calcium trigger neurotransmitter release? Curr Opin Neurobiol. 2001;11:320–326. - PubMed

Publication types

LinkOut - more resources